¶ Wiki of the CPE and Task Management System
¶ System Access
¶ Prerequisites
- The tool must already be installed and configured in the client's environment.
- After installation, you will receive the following information:
- Server address ip where the tool is hosted
- User access
- Access Password
¶ How to access
- Open your preferred browser (Google Chrome, Mozilla Firefox, Edge, etc.)
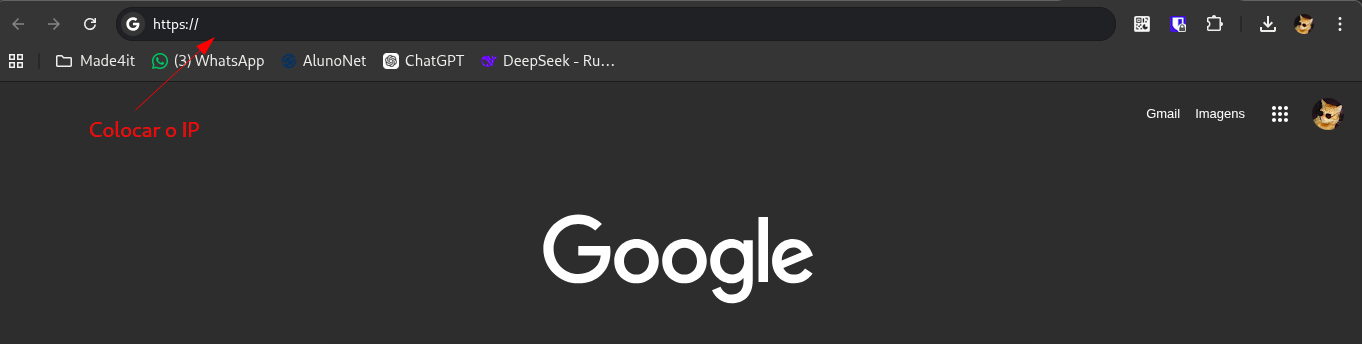
- In the address bar, type:
https://followed by ip provided
- Example:
https://192.168.1.100
- Press Enter to access
Note: As this is an HTTPS access with a self-signed certificate, the browser may display a security warning. This is normal in internal environments. Proceed to access the system.
¶ Login Screen
When accessing the address, you will see the login screen with two fields:
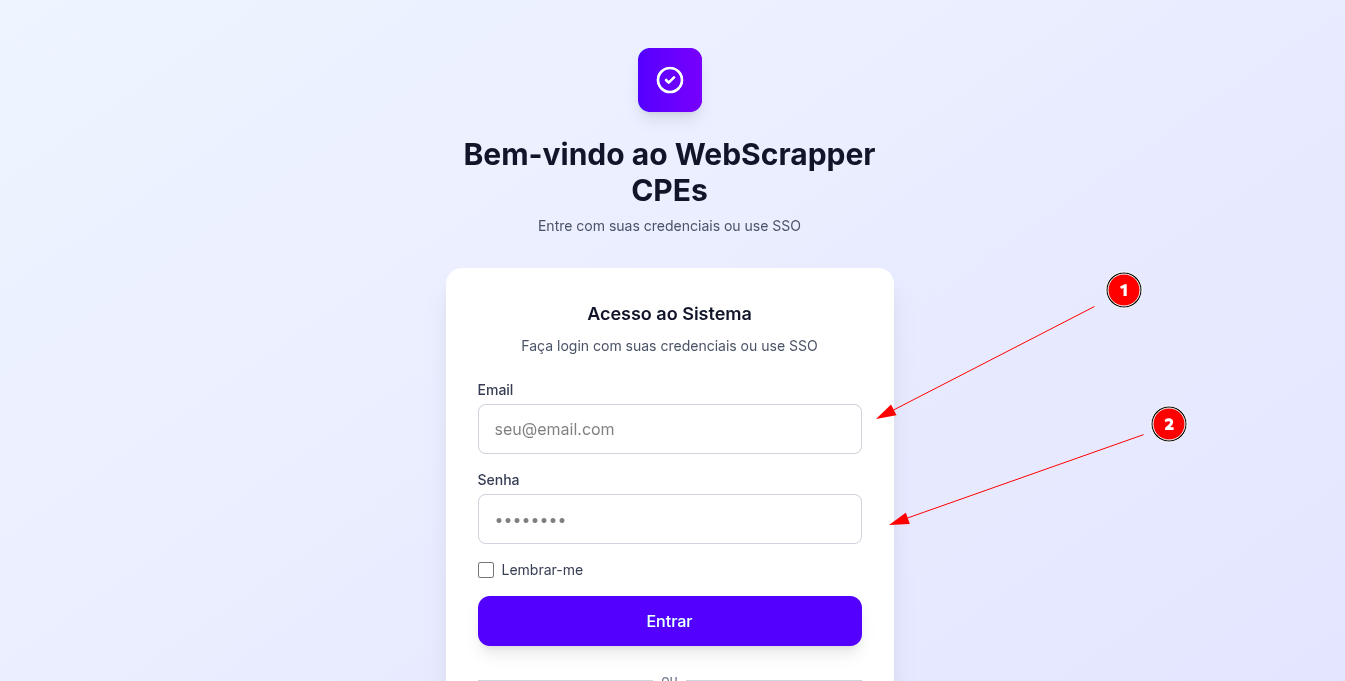
- Field 1 - User: Enter the username provided after installation
- Field 2 - Password: Enter the provided password
After correctly filling out both fields, click on the login button to access the system.
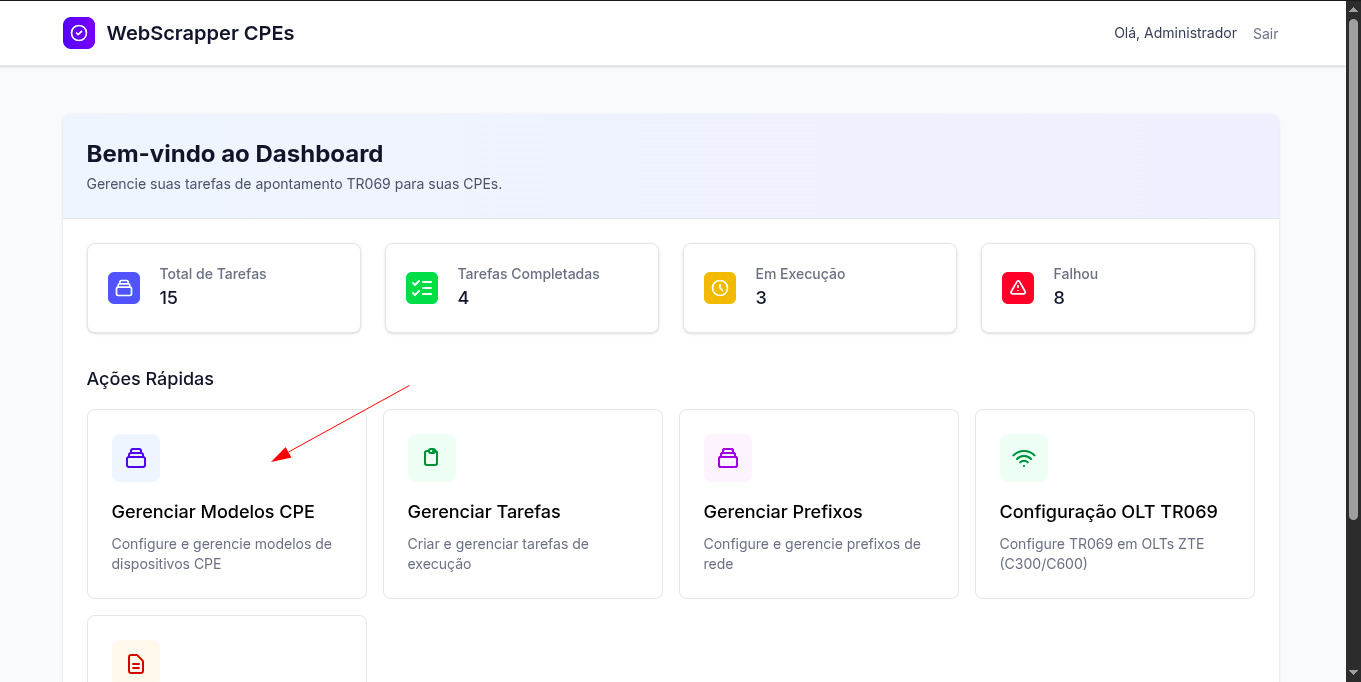
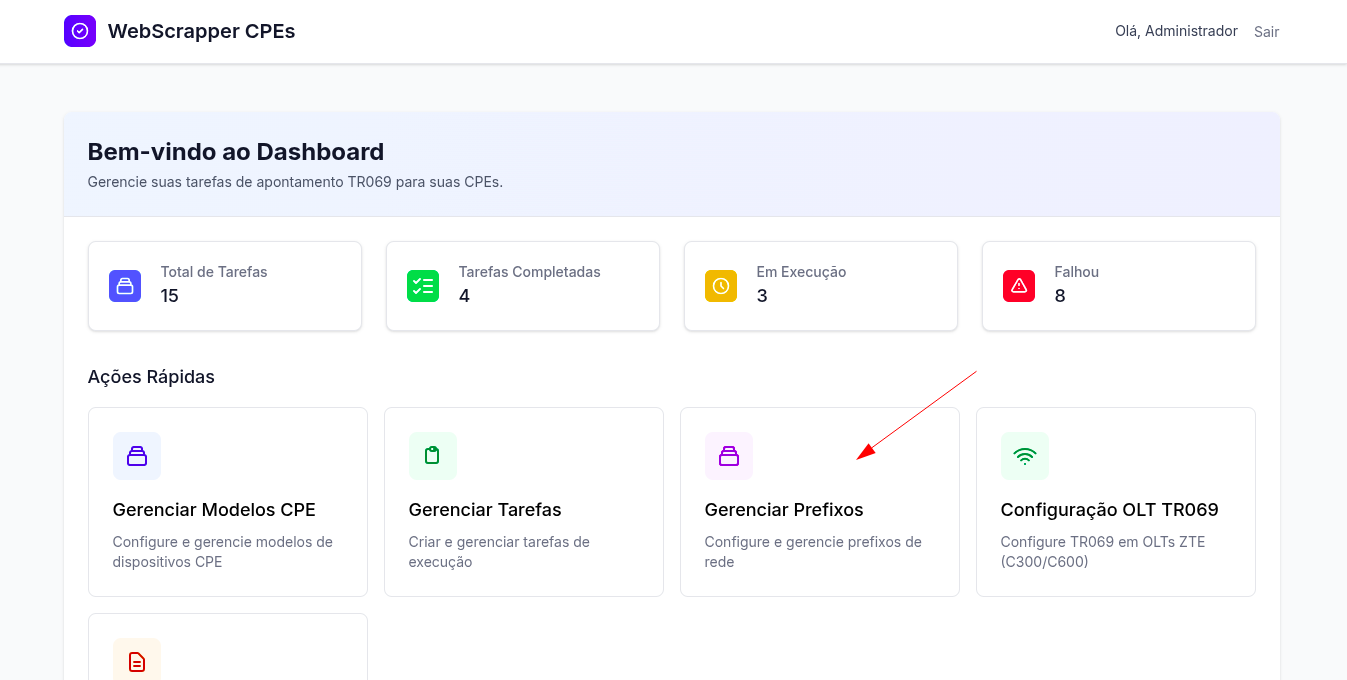
After logging in, the user is redirected to the home screen (Dashboard). This screen provides an overview of activities and task statistics:
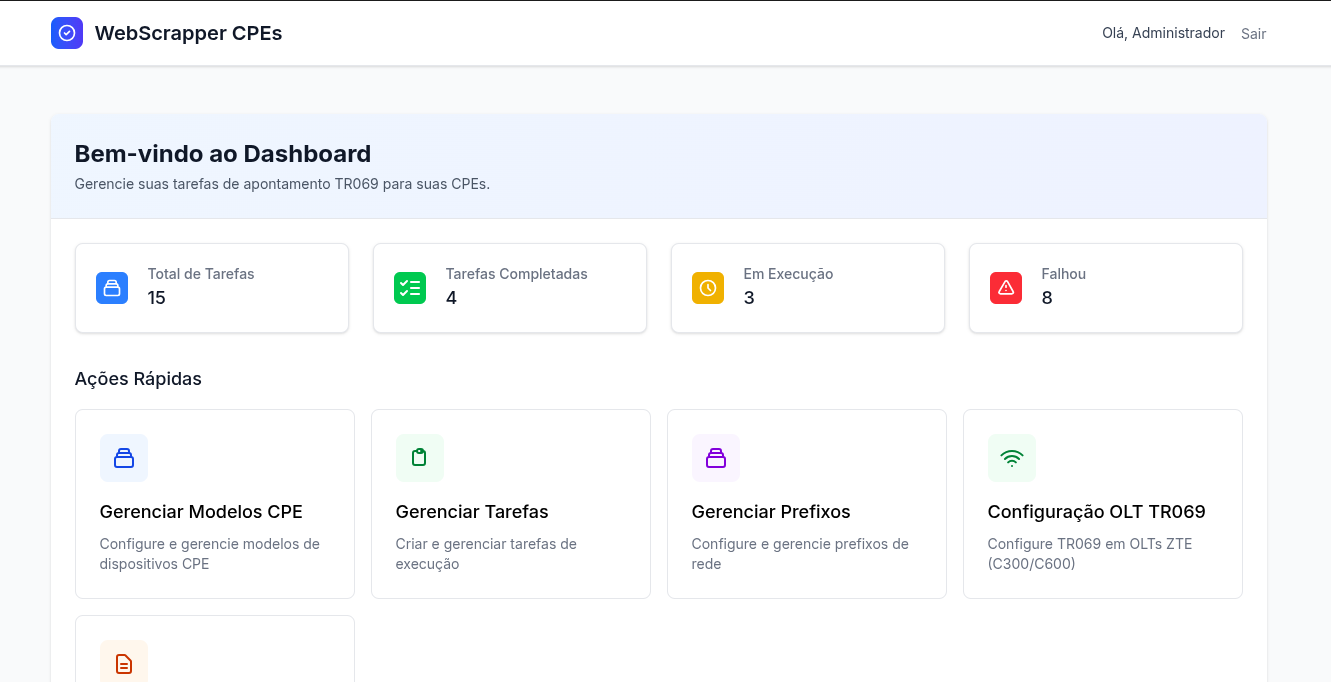
¶ Home Screen (Dashboard)
After logging into the system, the user is redirected to the home screen. This screen provides an overview of activities and task statistics:
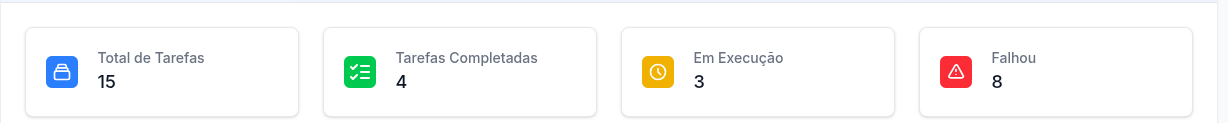
- Total Tasks: Displays the total number of tasks registered in the system.
- Completed Tasks: Quantity of tasks that have been successfully completed.
- Tasks in Progress: Tasks that are currently ongoing.
- Failed Tasks: Tasks that were executed but encountered an error or failed.
From this screen, the user can access the main functionalities of the system through the available options:
- Manage Templates cpe
- Manage Prefixes
- Manage Tasks
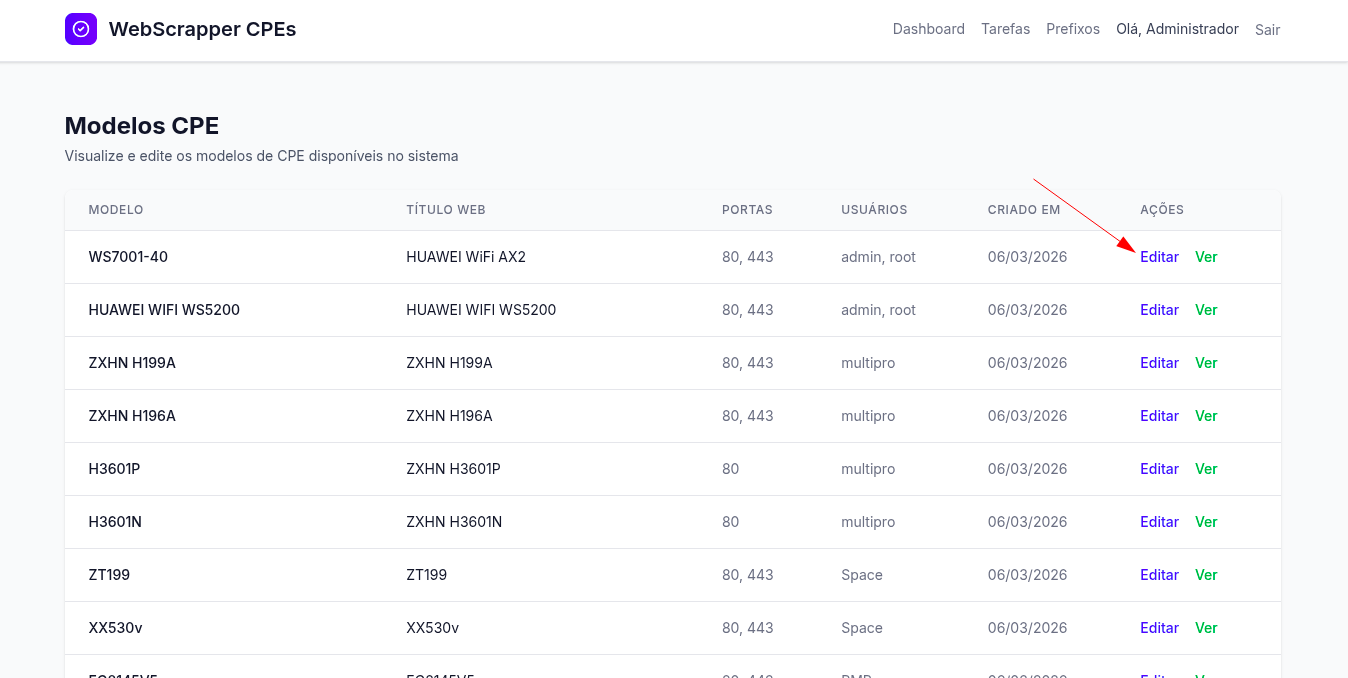
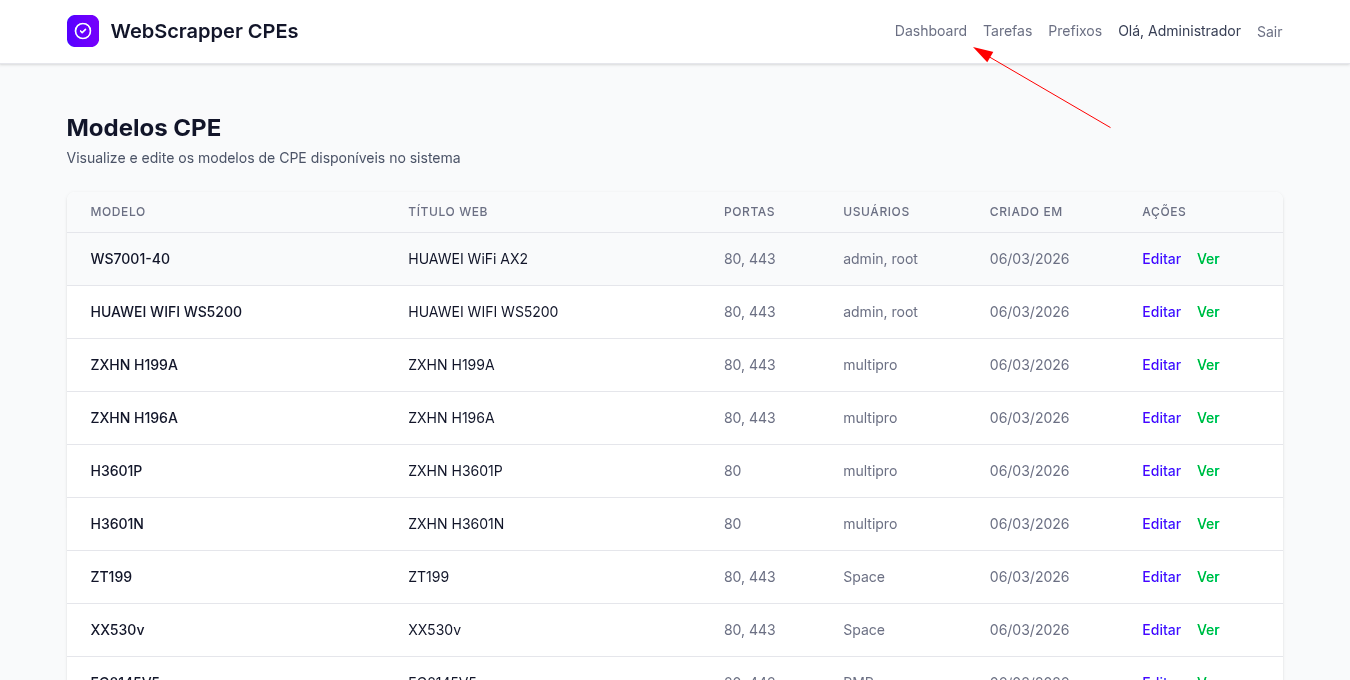
¶ Manage Templates cpe
When clicking on the "Manage Models cpe" option, the user is directed to a page that lists all cpe models (routers) registered.
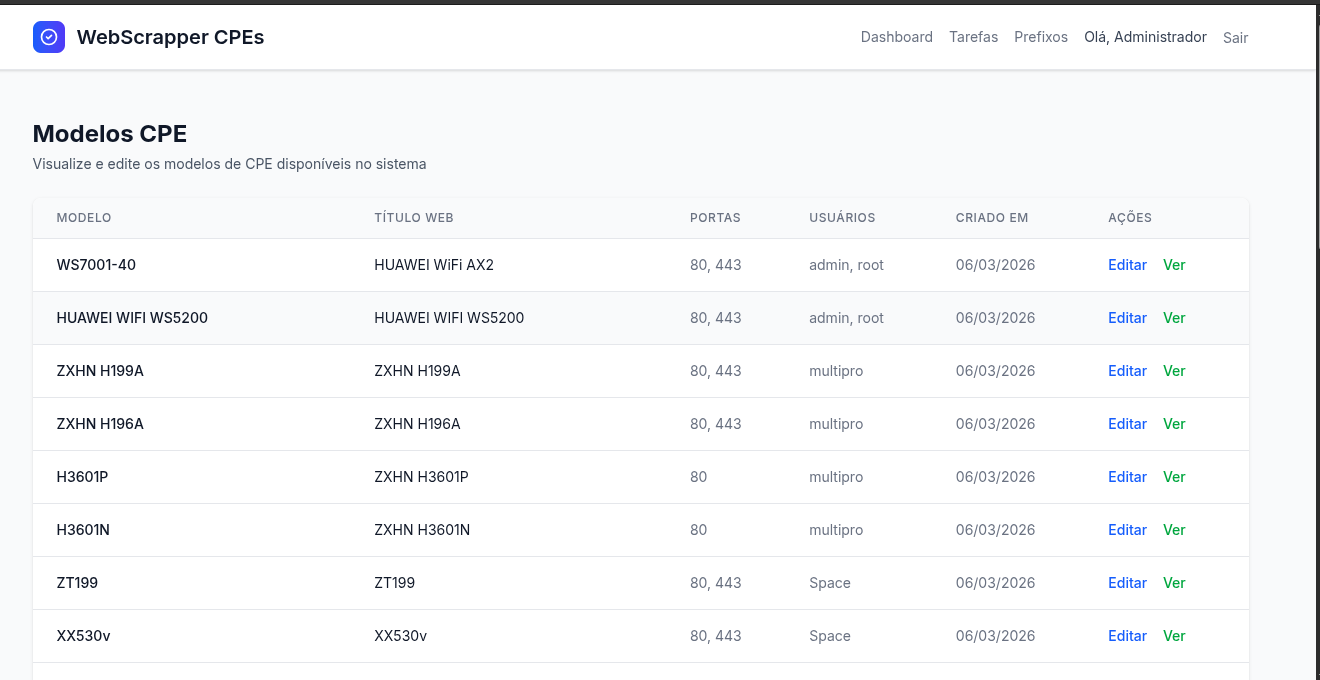
¶ Screen features:
- Visualization of the models with their respective characteristics, such as:
- Connection ports
- Standard users
- Specific observations
- Option "Edit" next to each template.
¶ Template Editing cpe
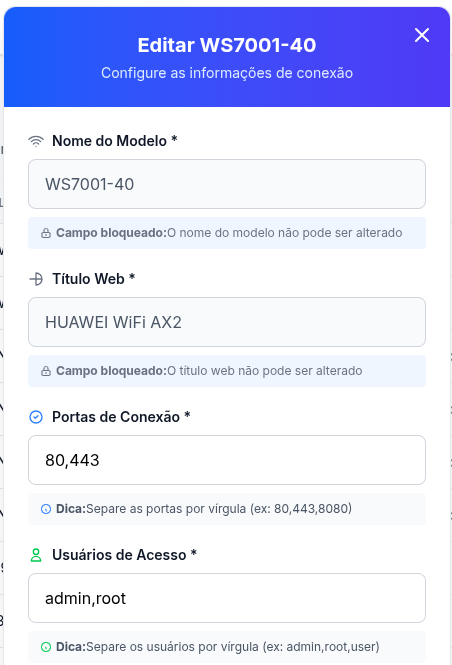
By clicking on "Edit", the user can modify the settings of the selected template:
- Connection ports (e.g. SSH port, HTTP port, etc.)
- Access user (Can be more than one password and user)
- Access password
Important: All changes must comply with the standards defined by the client (e.g. follow the password policy or default ports used).
After completing the changes, the user can return to the home screen by clicking on the "Dashboard" button.
¶ Manage Prefixes
On the home screen, the user can access the "Manage Prefixes" option. This page displays all the prefixes and ip blocks registered.
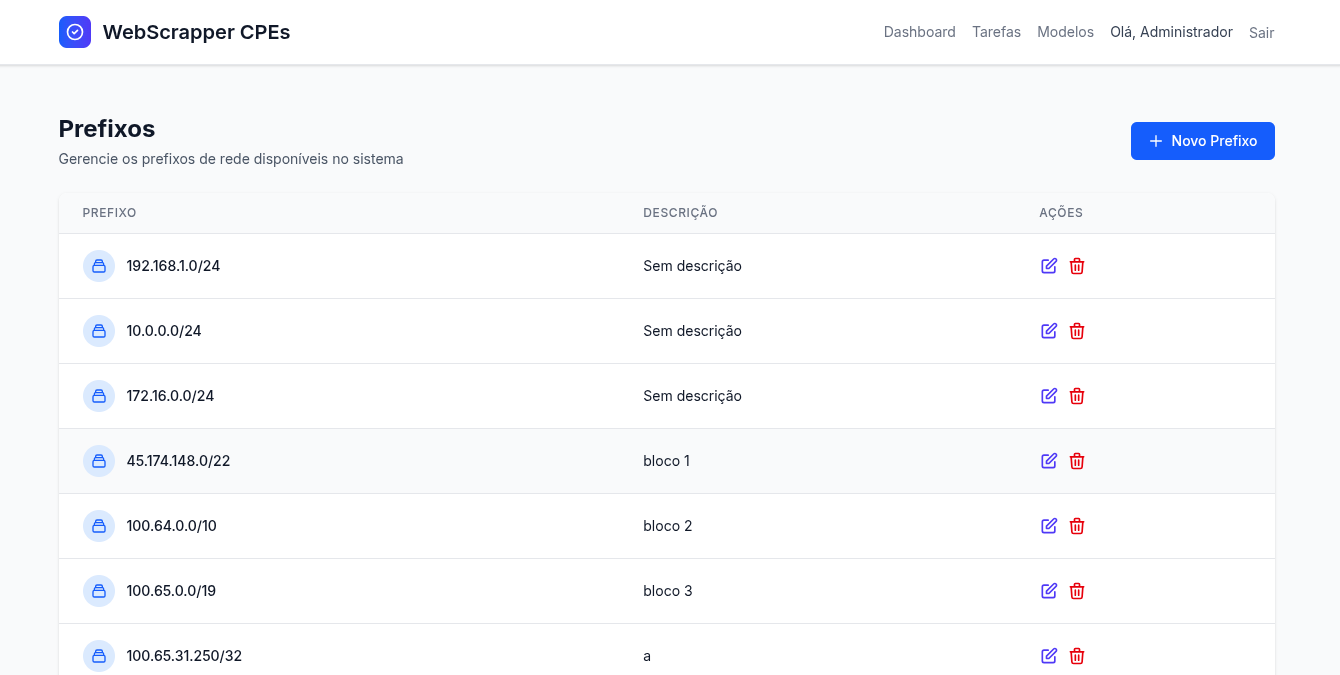
¶ Create a new prefix
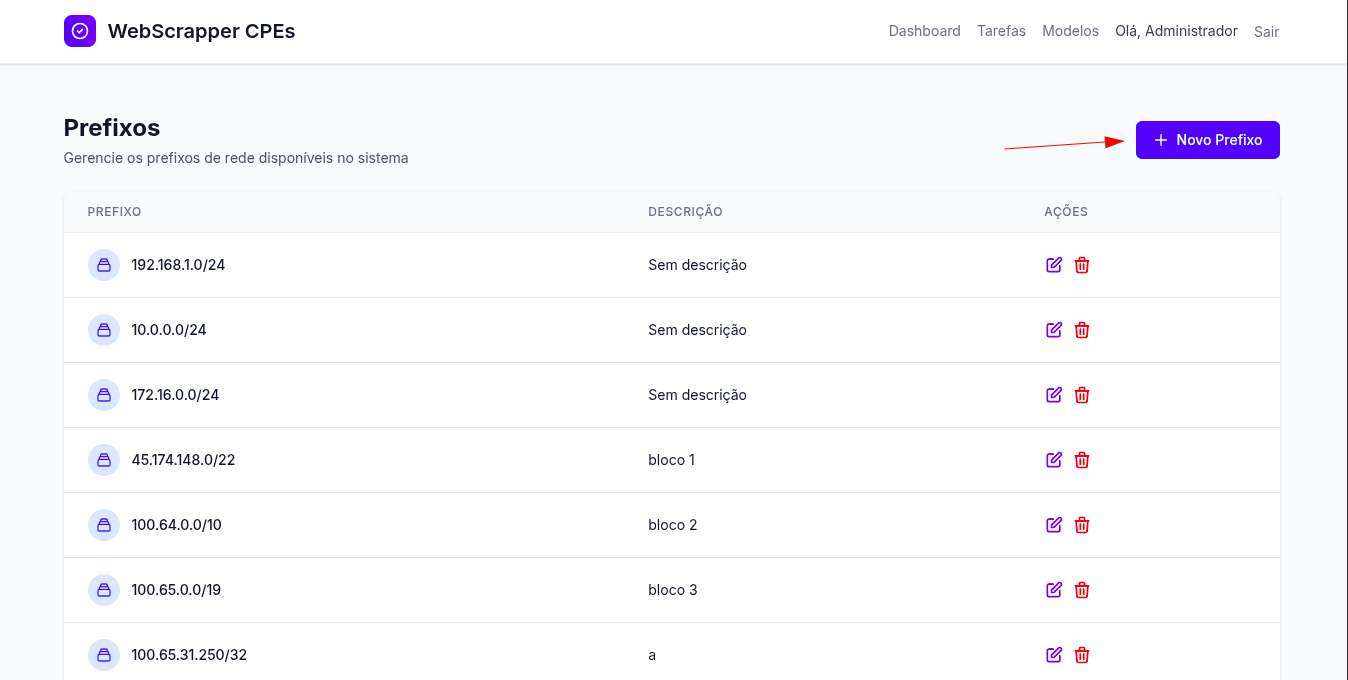
In the top right corner of the screen, there is a blue button to create a new prefix. When clicked, the user must fill in:
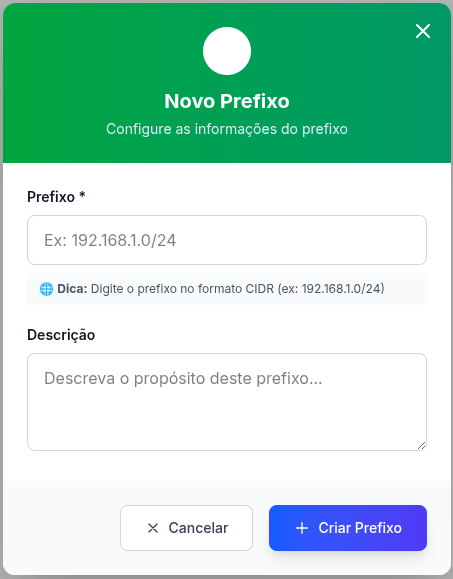
- ip: Address or block of ip (e.g.: 192.168.1.0/24)
- Description: Additional information about the prefix (e.g. "Headquarters corporate network")
After saving, the prefix is added to the list. The user can return to the Dashboard to continue navigating.
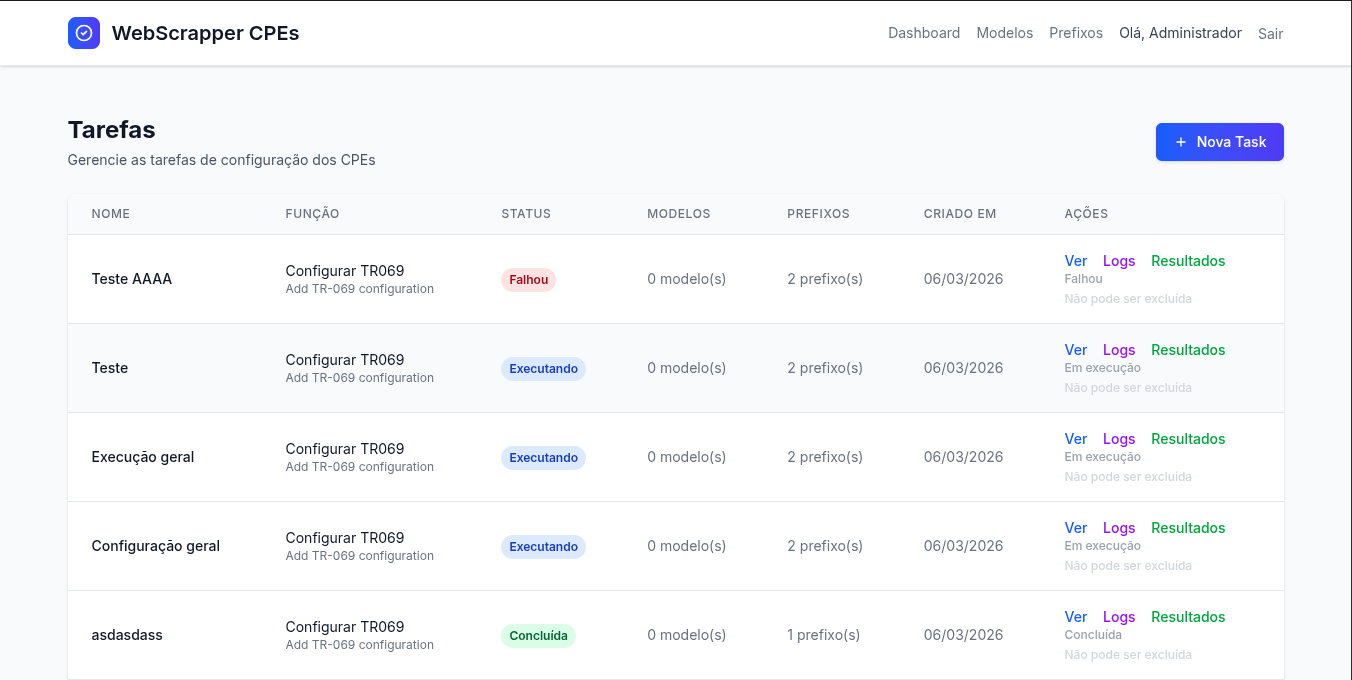
¶ Manage Tasks
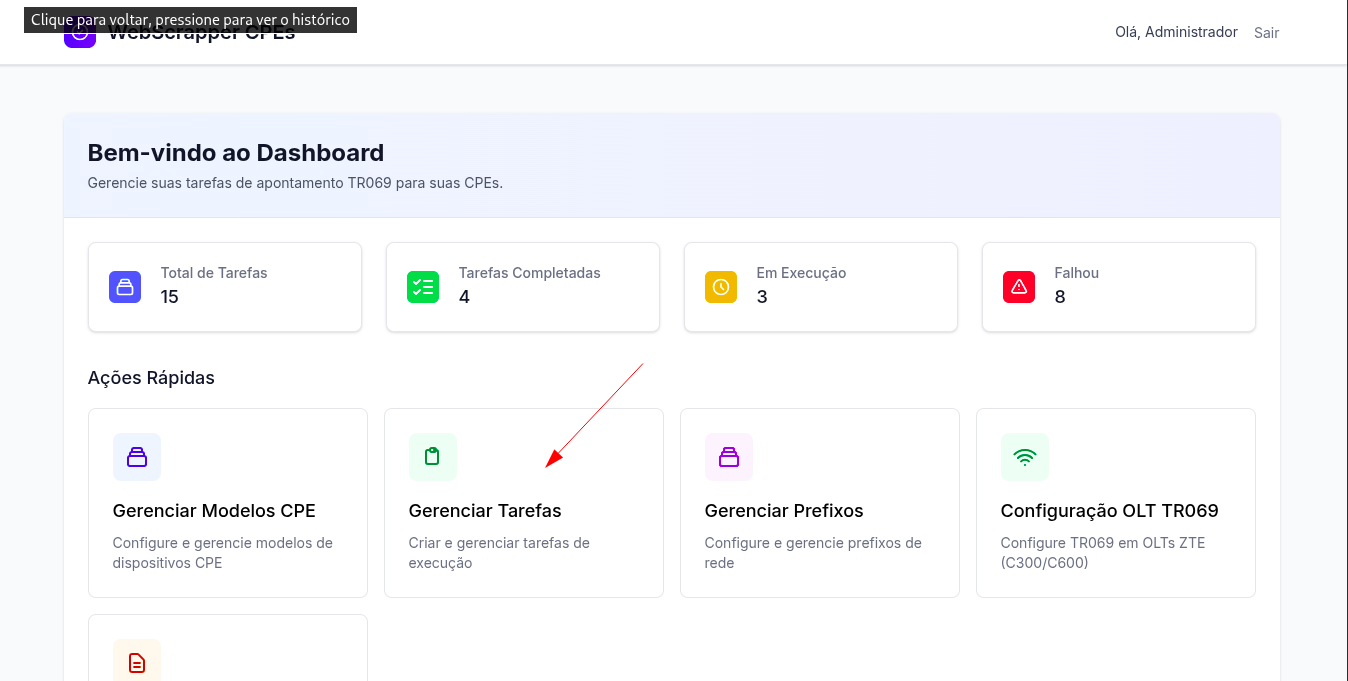
The "Manage Tasks" option allows the user to perform tests to identify issues in the network.
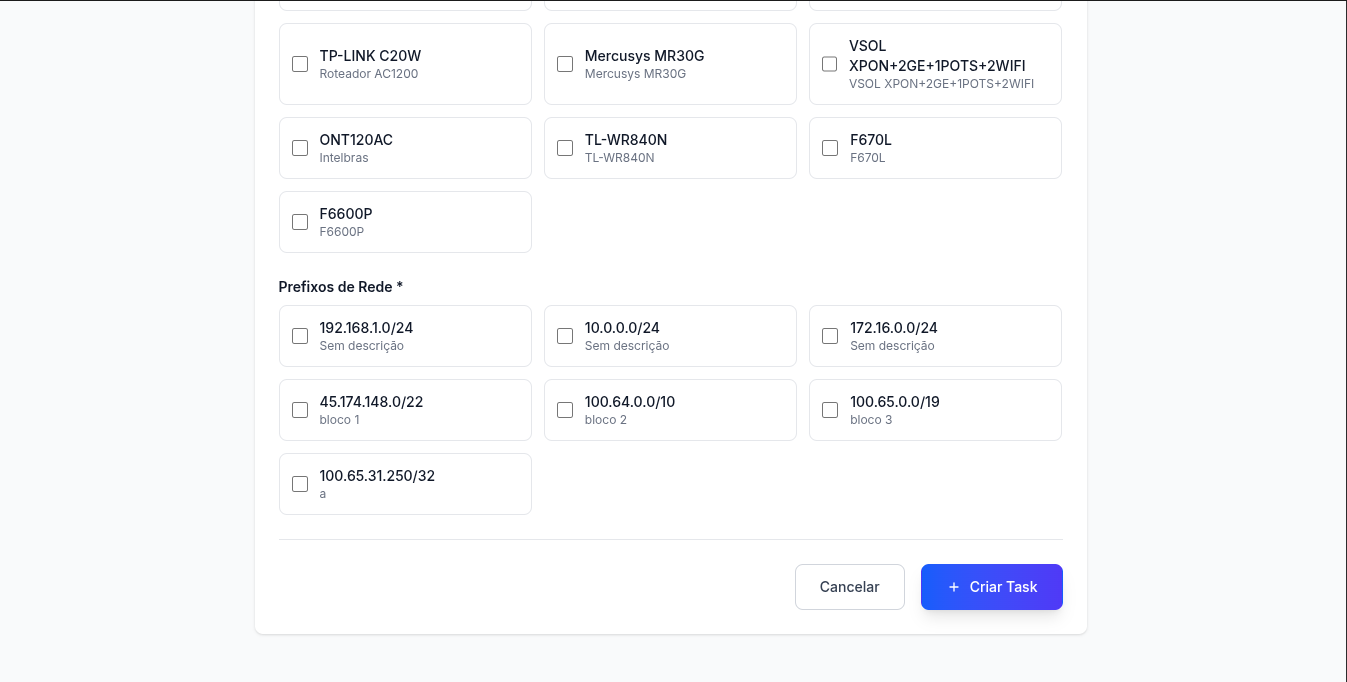
¶ Create a new task (New Task)
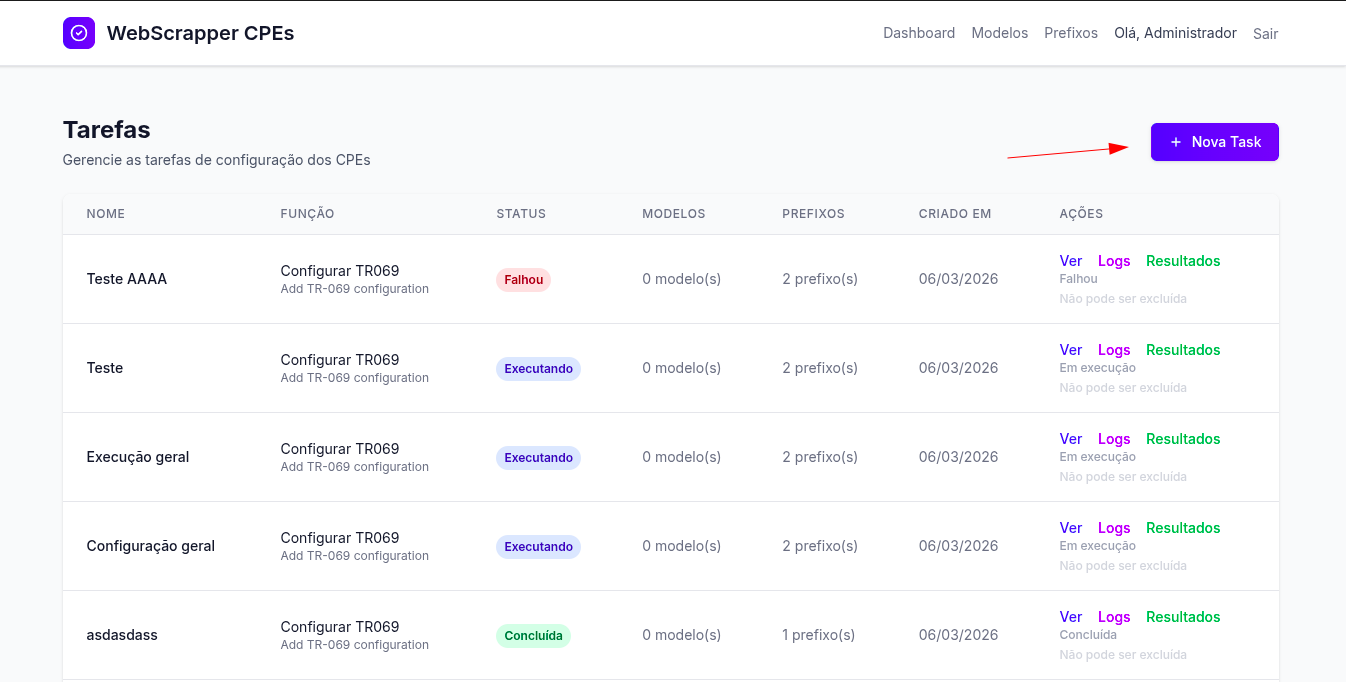
When you click the "New Task" button, a form is displayed with the following fields:
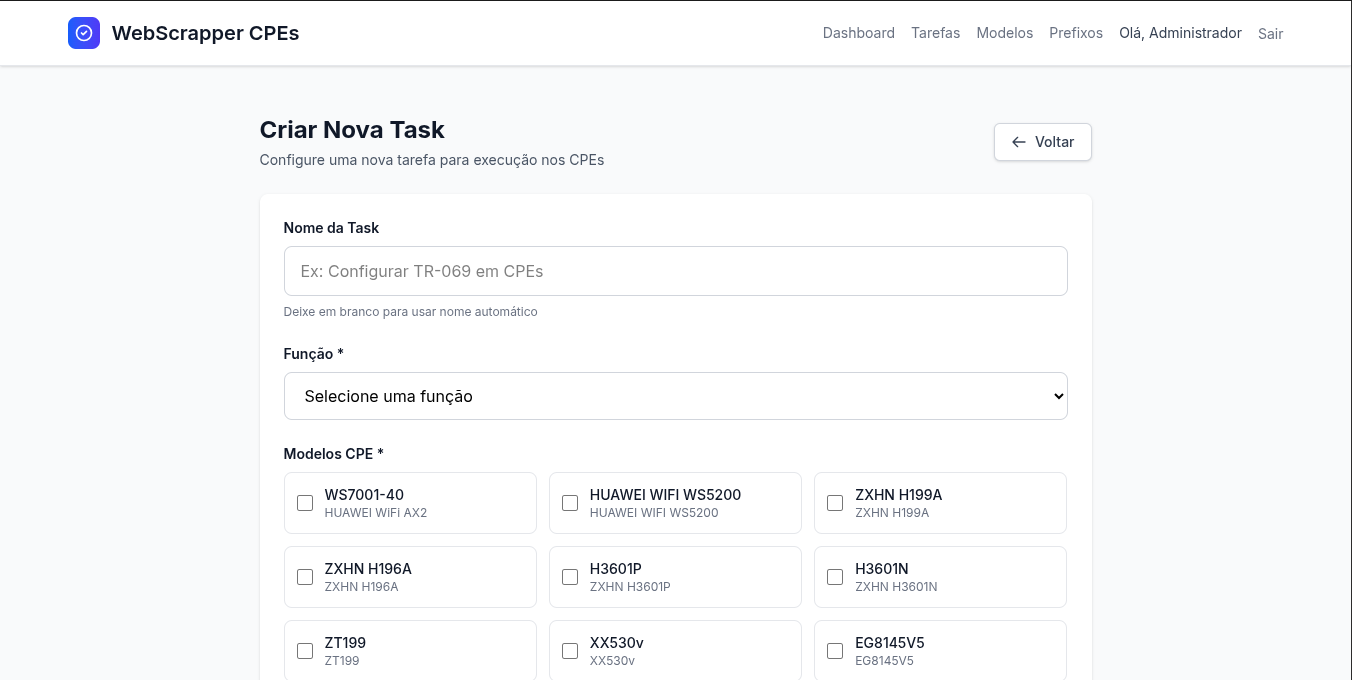
- Test Name: Task Identification (e.g. "Matrix Connectivity Test").
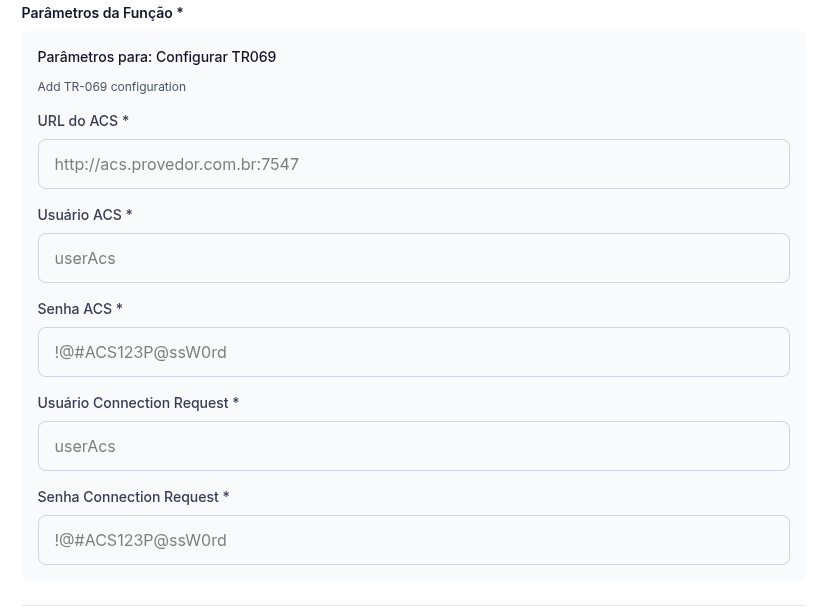
- Function: Mandatory field with a single correct alternative (single choice).
- Selection of CPEs: Choose one or more models from cpe (previously registered) to participate in the test.
- Prefix Selection: Choose one or more prefixes (created in the previous feature) that will be used in the test.
- acs URL: Enter the URL of the acs tool.
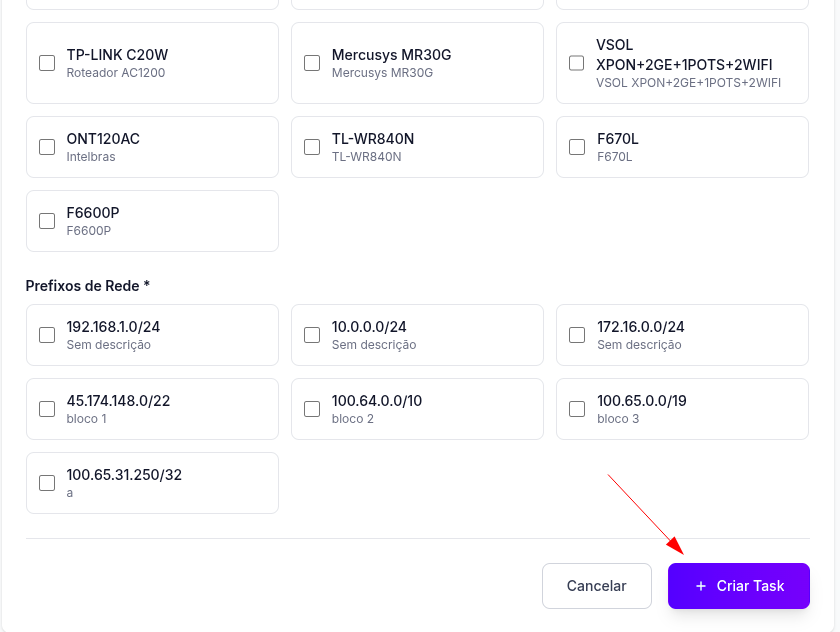
After filling in all the information, the user must click on the "Create Task" button to schedule or run the test.
¶ Follow-up
The created tasks will appear on the "Task Management" page list and their status can be tracked (Completed, In Progress, Failed), reflecting the statistics displayed on the Dashboard.
¶ Navigation
- The "Dashboard" button is available on several screens to quickly return to the home page.
- The main flow of the system is:
Login → Dashboard → (Manage Models cpe / Manage Prefixes) → Manage Tasks → Task Creation.