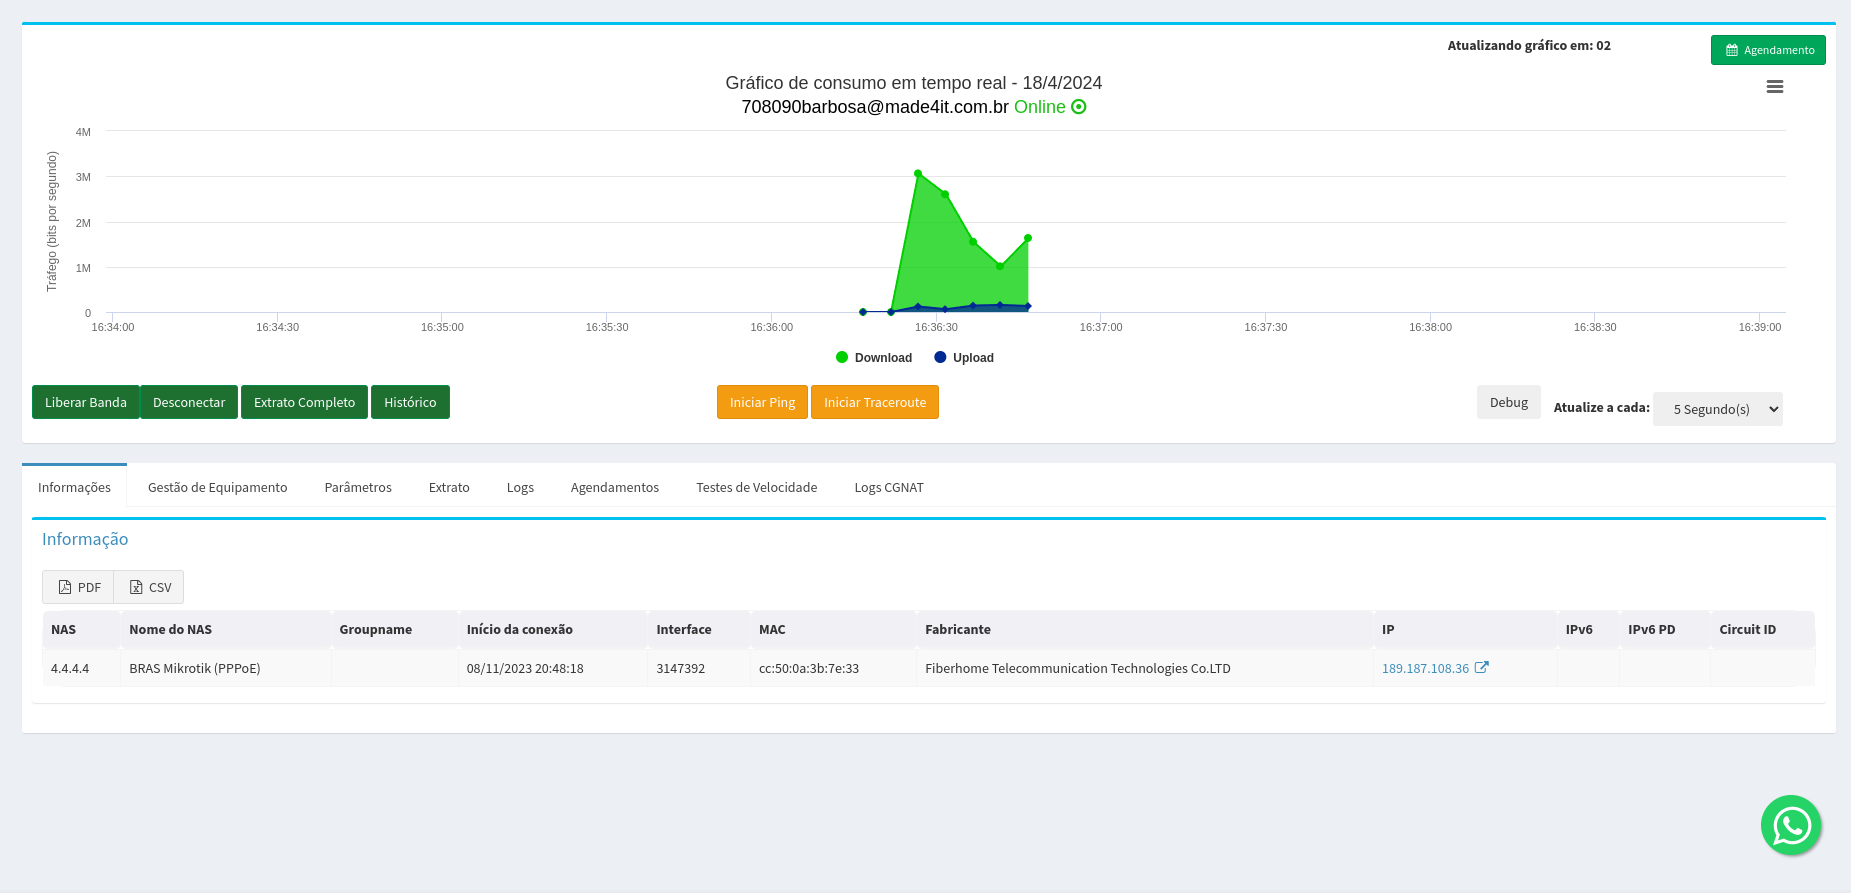
¶ Realtime - Real-time Bandwidth Consumption
The Realtime feature allows you to track the client's bandwidth consumption in real time, displaying the Download and Upload traffic on the active connection graph.
The chart displays traffic in bits per second (bps) and is constantly updated to reflect the current usage of the connection.
¶ Consumption Chart
On the Realtime screen, a chart will be displayed with:
- Download (green)
- Upload (blue)
Graph axis:
Traffic (bits per second - bps)
The chart shows the bandwidth consumption behavior at that moment, allowing for quick identification:
- peak usage
- low consumption moments
- connection stability
¶ Difference between Realtime and Historical
It is important to understand that the values on the real-time chart and the historical chart will not be exactly the same, as they use different time intervals.
¶ Realtime
- Approximate update: every 5 seconds
- Represents the average consumption within this small interval.
¶ History
The historical chart shows average consumption over longer periods, which varies depending on the selected interval.
Example:
| Analyzed period | Average range |
|---|---|
| Last 2 days | averages of approximately 10 minutes |
| Last 30 days | averages about 2 hours |
For this reason, differences can occur between the graphs, especially when there are peaks in consumption over short periods.
To check the exact time of a point on the historical chart, simply hover over the graph line.
¶ Release Bandwidth
The Bandwidth Release option allows temporarily releasing a higher speed for connection tests.
To use:
- Adjust the desired band on the Global Parameters tab.
- Click on Release Bandwidth to apply the test.
After finishing the tests, it is necessary to disconnect the client so that they can reconnect with the normal speed of the plan.
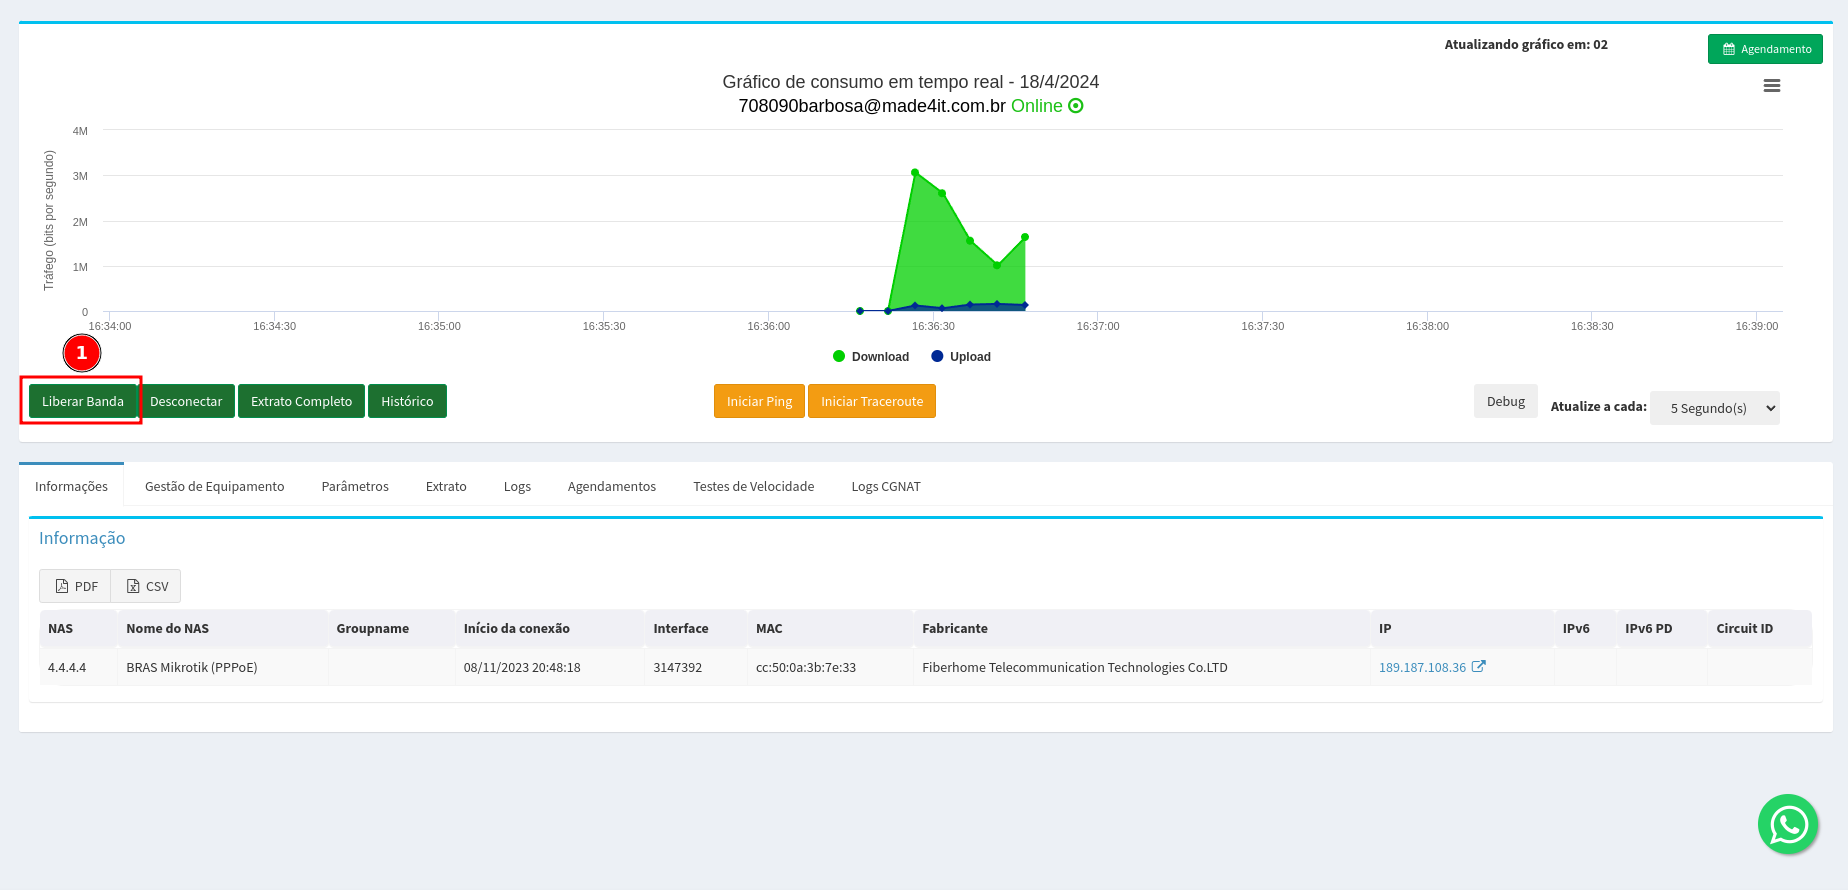
¶ Other Available Actions
On the Realtime screen, there are also some diagnostic and query tools available.
¶ Disconnect
Ends the active client session.
When reconnecting, the client will return with the normal plan settings.
¶ Full Statement
Allows you to view the client's connection history.
¶ History
Open the traffic consumption chart in longer periods.
¶ Network Tests
Available tools for diagnosis:
- Ping - checks latency and connectivity.
- Traceroute - shows the network path to the destination.
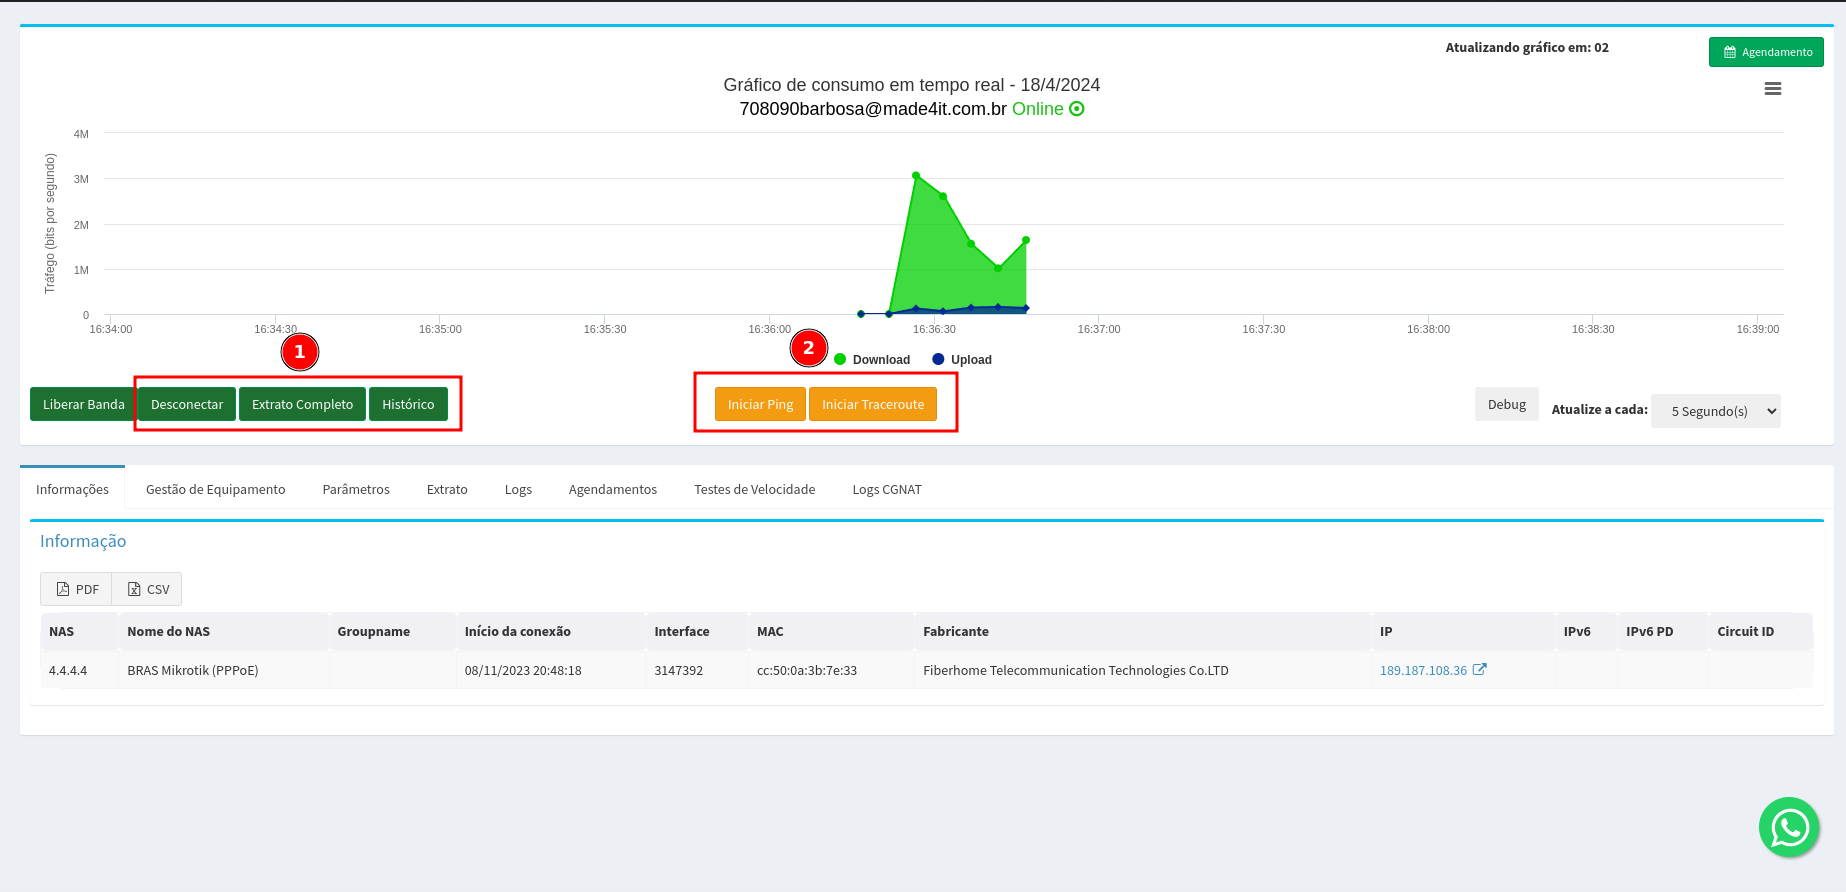
¶ Connection Information Tabs
At the bottom of the screen, there are several tabs that provide additional information about the client's connection, activity history, and diagnostic tools.
Below is a summary of the content available on each tab.
¶ Information
The Information tab displays the data of the current session and recent client connections.
It is possible to view details such as:
- authentication equipment used (NAS/BRAS)
- connection start date and time
- address ip assigned to the client
- information of the connected device
These data help identify when the client connected and on which network device the authentication occurred.
¶ Equipment Management
The Equipment Management tab displays customer equipment information when integrated via tr-069.
Data can be displayed as:
- equipment model
- software version
- hardware version
- address ip and MAC
- last communication with the system
This tab allows you to track router information or onu client.
¶ Parameters
The Parameters tab displays the network settings associated with the client.
Among the available information may be:
- IPv4 and IPv6 addresses
- IPv6 prefix
- authentication user
- bandwidth control parameters (download and upload)
These pieces of information represent the connection and speed parameters applied to the client.
¶ Statement
The Statement tab shows the client's connection history.
It is possible to view records containing:
- start and end of connections
- total connection time
- reason for disconnection
- upload and download volume used
- ip used during the session
This log allows you to track when the client connected, disconnected, and how much traffic was used in each session.
¶ Logs
The Logs tab displays the client authentication records on the access server (Radius).
These logs show events such as:
- authentication attempts
- information about the equipment used
- Identification of the NAS responsible for authentication
- event schedule
These records help analyze login and connection authentication events.
¶ Appointments
The Appointments tab allows you to view scheduled tasks related to the client.
Among the examples of use:
- scheduled bandwidth releases
- tests or actions scheduled for a specific period
It is also possible to consult previous appointments and history of these actions.
¶ Speed Tests
The Speed Tests tab displays the history of tests performed by the client.
Information such as:
- date and time of the test
- address ip used
- download speed
- upload speed
- latency (ping)
- jitter
These data help analyze the performance of the connection in tests previously conducted.
¶ CGNAT Logs
The CGNAT Logs tab shows records related to port usage in environments using CGNAT (Carrier Grade NAT).
These records can indicate events such as:
- attempts to use unavailable ports
- number of recorded attempts
- event schedule
- severity level
This information helps in identifying network behaviors or applications that make many simultaneous connections.
¶ How to Validate Realtime
If it is necessary to validate the consumption displayed on the chart:
- Check if there are no duplicate sessions for the client.
- Perform the download of a large file or a speed test.
- Track consumption on the graph to verify if it is compatible with the expected speed.
This helps to visualize the connection behavior more accurately on the real-time graph.
¶ Observations
- The Realtime chart represents the average consumption for each update interval.
- Small variations are normal due to network traffic behavior.
- For analysis of longer periods, always use the historical chart.