¶ Raw Data
Explaining the Made4Flow Raw Data report
¶ What is Raw Data?
The Raw Data report is a form of granular visualization of data. Within it, it is possible to know exactly which IPv4/IPv6, Origin/Destination Port, Source/Destination ASN, and also other information that was used on the network.
We can draw an analogy with Mikrotik's “Torch” function, where we can view data in a very specific way.
¶ Main uses of this report?
With this specific information, we can use it in several cases to thoroughly find a problem or anomaly in the network. We can cite as an example:
-
DDoS attack: At times of DDoS attacks we can see that graphics inside Made4Flow will go up and we can see an ASN or App having abnormal traffic, you can click on the graph and generate the raw data report and know exactly who the user/IPv4/IPv6 was being attacked
-
Traffic anomalies: in case of anomalies or unusual traffic, we can click on the graph or access via the Raw data page and find out exactly which IPv4/IPv6, Port/Application, Protocol, SN Origin/Destination has abnormal traffic.
There are many other applications and purposes for this report, but our main purpose is to show the information in a granular form.
¶ What information does the Report show me?
The report displays the following information:
Protocol, Source and Destination Address, Source and Destination Port, Source and Destination AS, Input and Output Interface, TCP Flag, Packets, Bytes, Flows, Bits per Second, Packets per Second, Packets per Second.
¶ How to access Raw Data?
We have 2 ways to access:
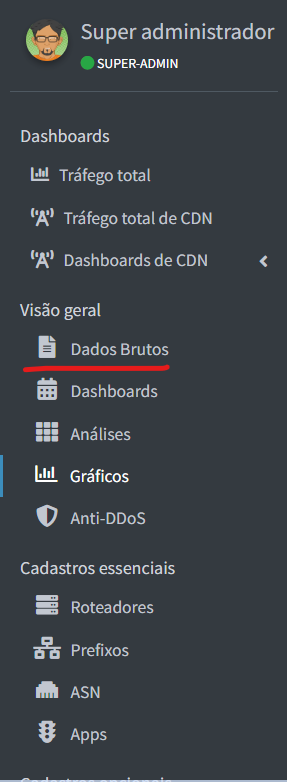
1 - Access the menu -> Raw Data
2 — On any chart in the System you can click and generate, request, generate a report.


¶ Explaining the Raw Data page
Within the Raw Data screen, it is possible to access data at any time, not depending on accessing the graph to generate the report.
Within the page we have the following options:

Date: Here you must choose which date and time you want to see the data. The data in Made4flow is always generated every 5 minutes, if you wanted to see information that occurred at 9:38 in the morning, you should choose 9:40.
Router: It is the Router configured within Made4flow, it is only possible to see raw data from routers that are correctly configured and with the correct export configuration within the Router
Select the fields: Here you can select which information you wanted to filter, we have the options to:

These options can be the same or negated through the next filter on the right

= This symbol refers to equal to
! = This symbol refers to other than

In this field you can enter the interface, port, ASN, CDN, or information for the selected field. For example, you want to filter by interface 1, so you choose in the field: Interface, in the next field you enter “=”, in the next field 1.

Finally, we can combine several filters to have a report with more filters and more specific information. You can combine as many filters as you like.
An example of a query would be:

See also our video tutorial: