¶ Identifying attacks, false positives, and adjusting thresholds
¶ Purpose of this Wiki
Assist in identifying DDoS attacks, false positives, and necessary adjustments to anti-DDoS thresholds and damping rules.
¶ Checking for anomalies
-
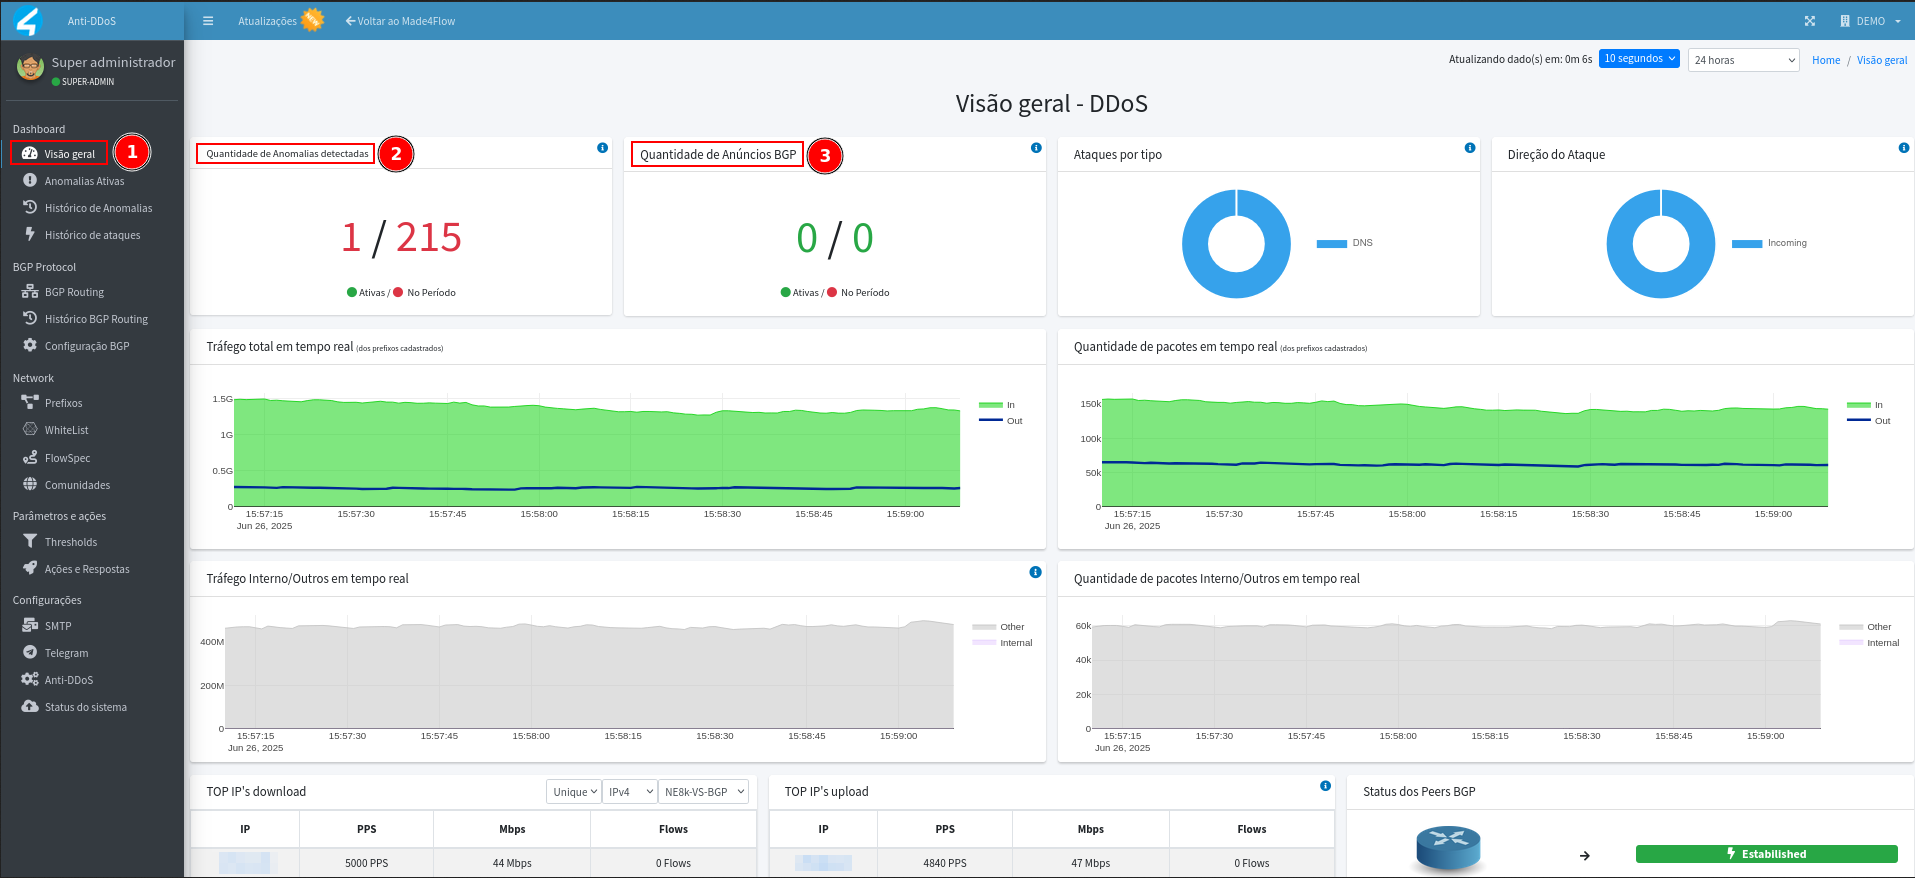
Within the Anti-DDos module, access the Overview or Active Anomalies tab in Anti-DDos to check for currently active anomalies:
-
If there are anomalies, give priority to the most recent ones for analysis. This may indicate:
- Attack: validate intensity in the graphics and whether the ad is being sent to BGP.
- False positive: confirm that the graphics remain linear and adjust thresholds.
-
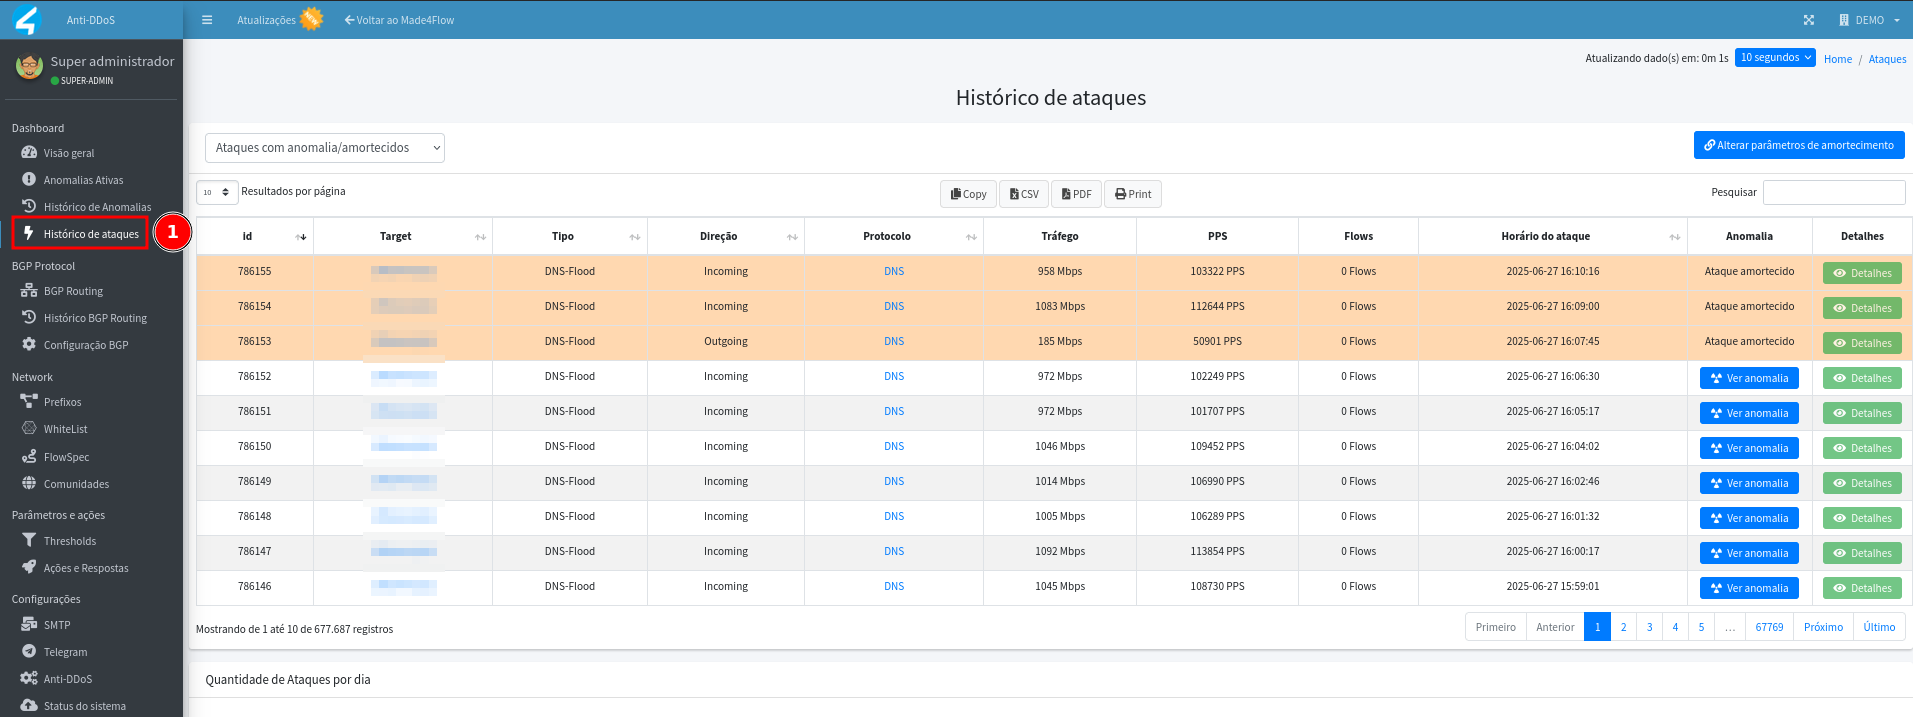
To view the history, go to the Attack History tab, where alerts are listed from the most recent to the oldest occurrence:
-
In the history, information such as target, type, direction, protocol, etc. is displayed:
- Dampened attack (yellow) : no action was taken, that is, the damper was not exceeded the minimum number of times defined for the anomaly to be considered an attack, this rule is important to help prevent route advertising for legitimate traffic.
- **Anomaly: ** the rules defined within the thresholds and the damper exceeded the defined limits, and as a result mitigation announcements, blackhole, flowspec, alerts on Telegram or e-mail, may have been generated, depending on the actions and automatic responses configured for the alerted threshold.
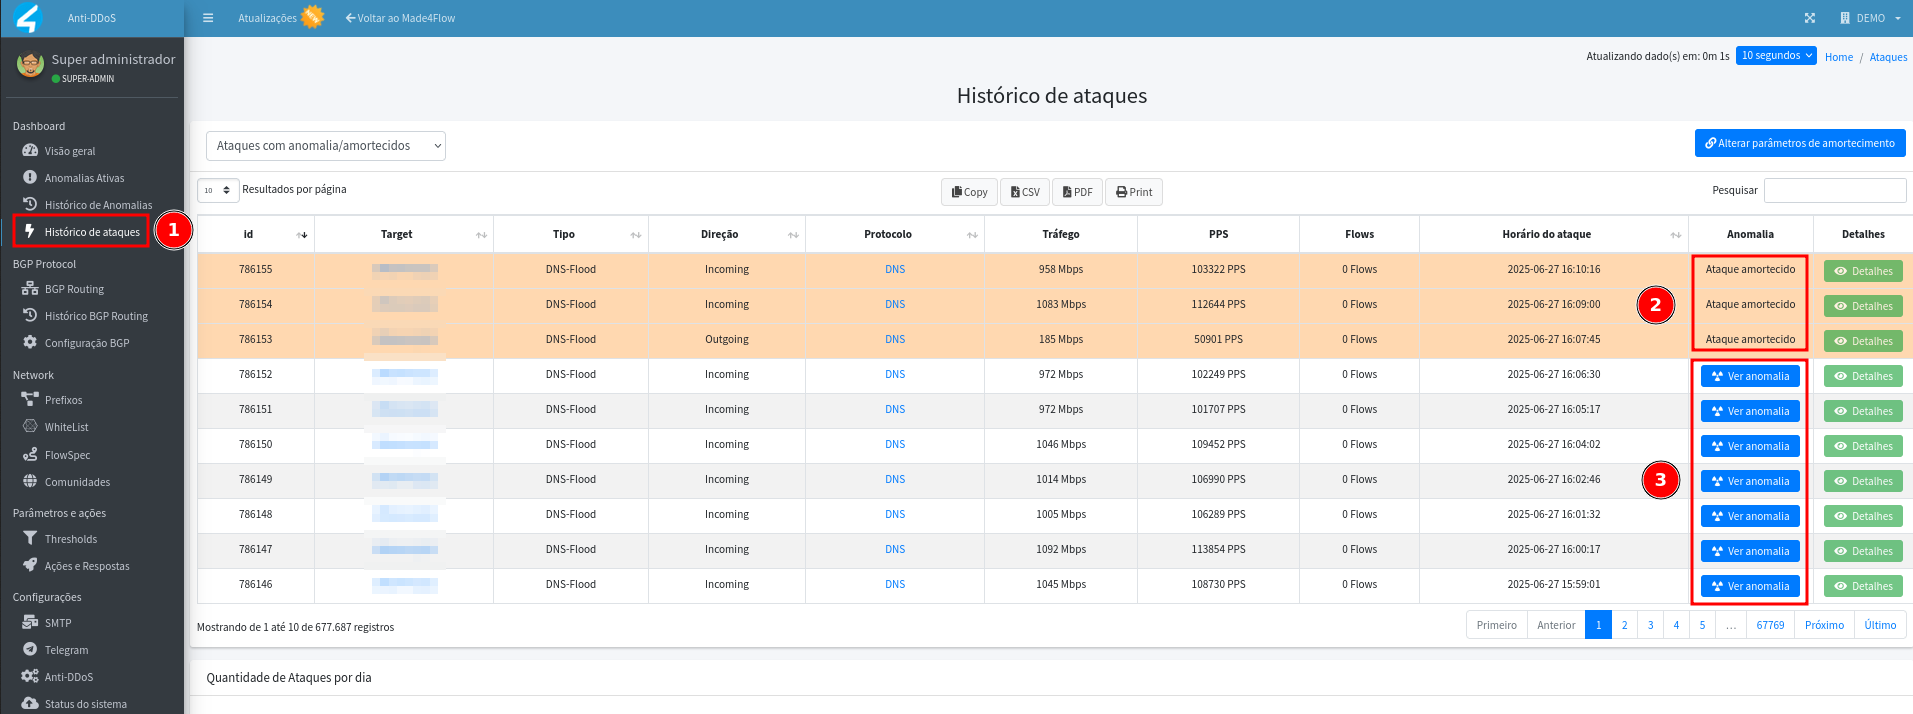
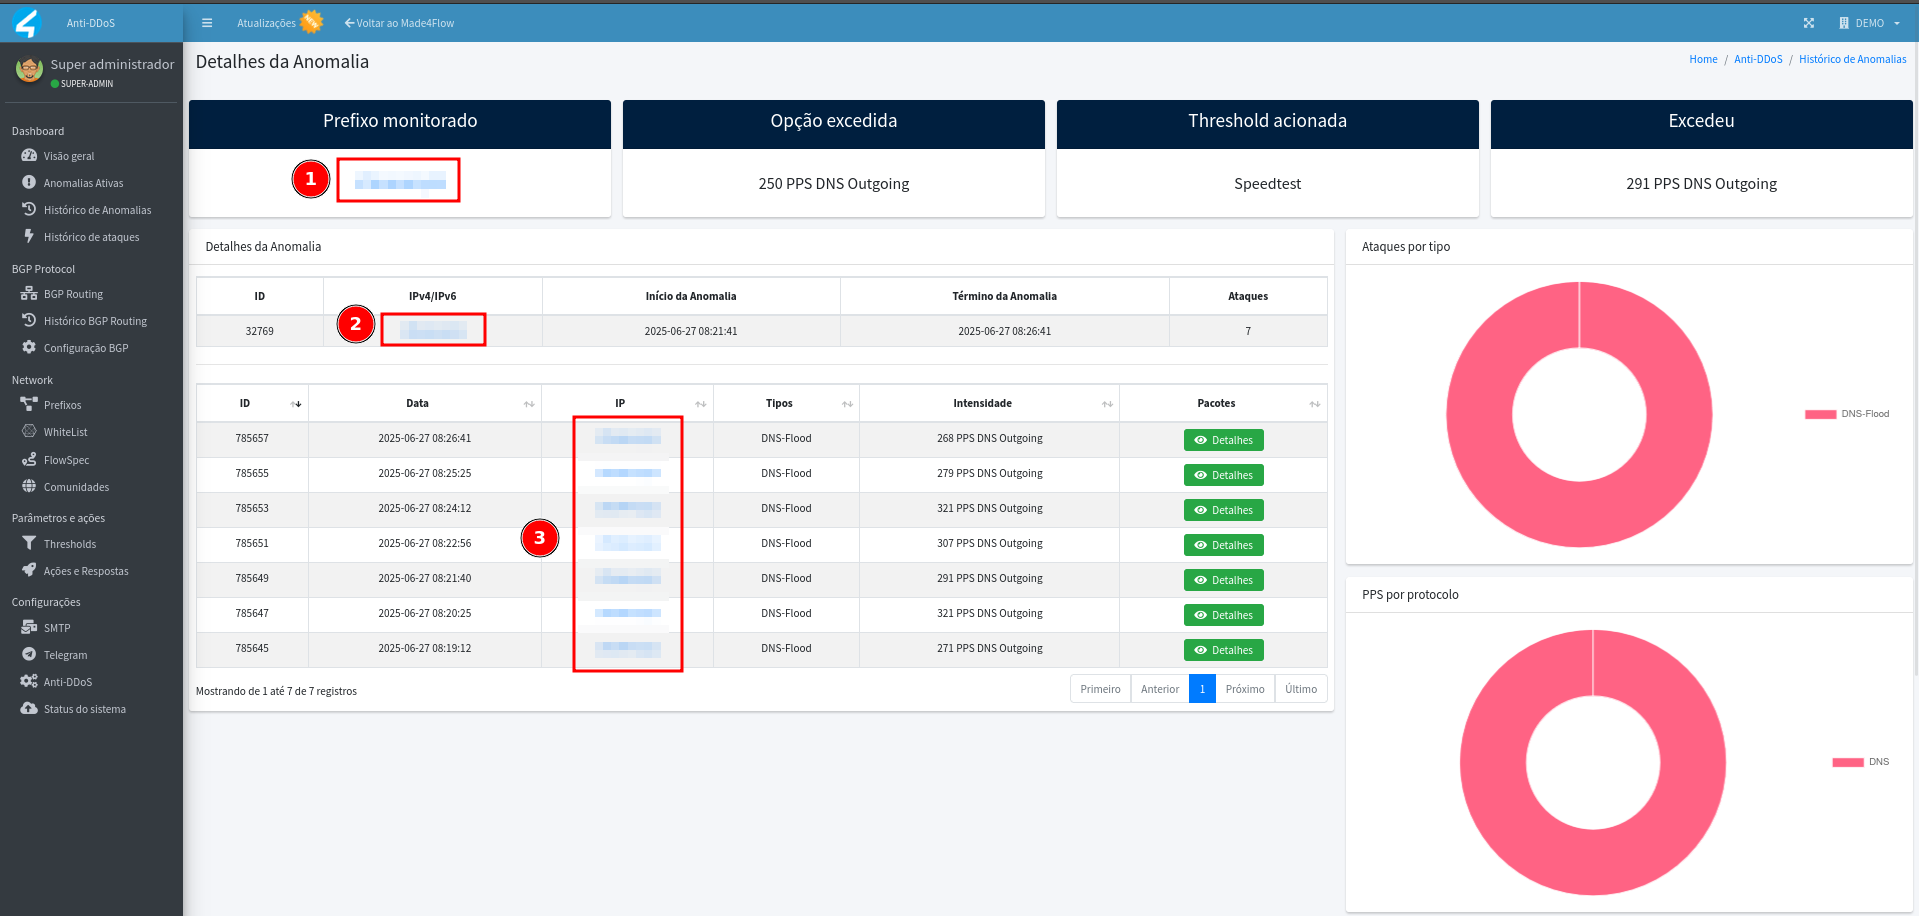
- For more details of the anomaly, click View Anomaly.
- Displays prefix, threshold exceeded, option exceeded, time, and other details:
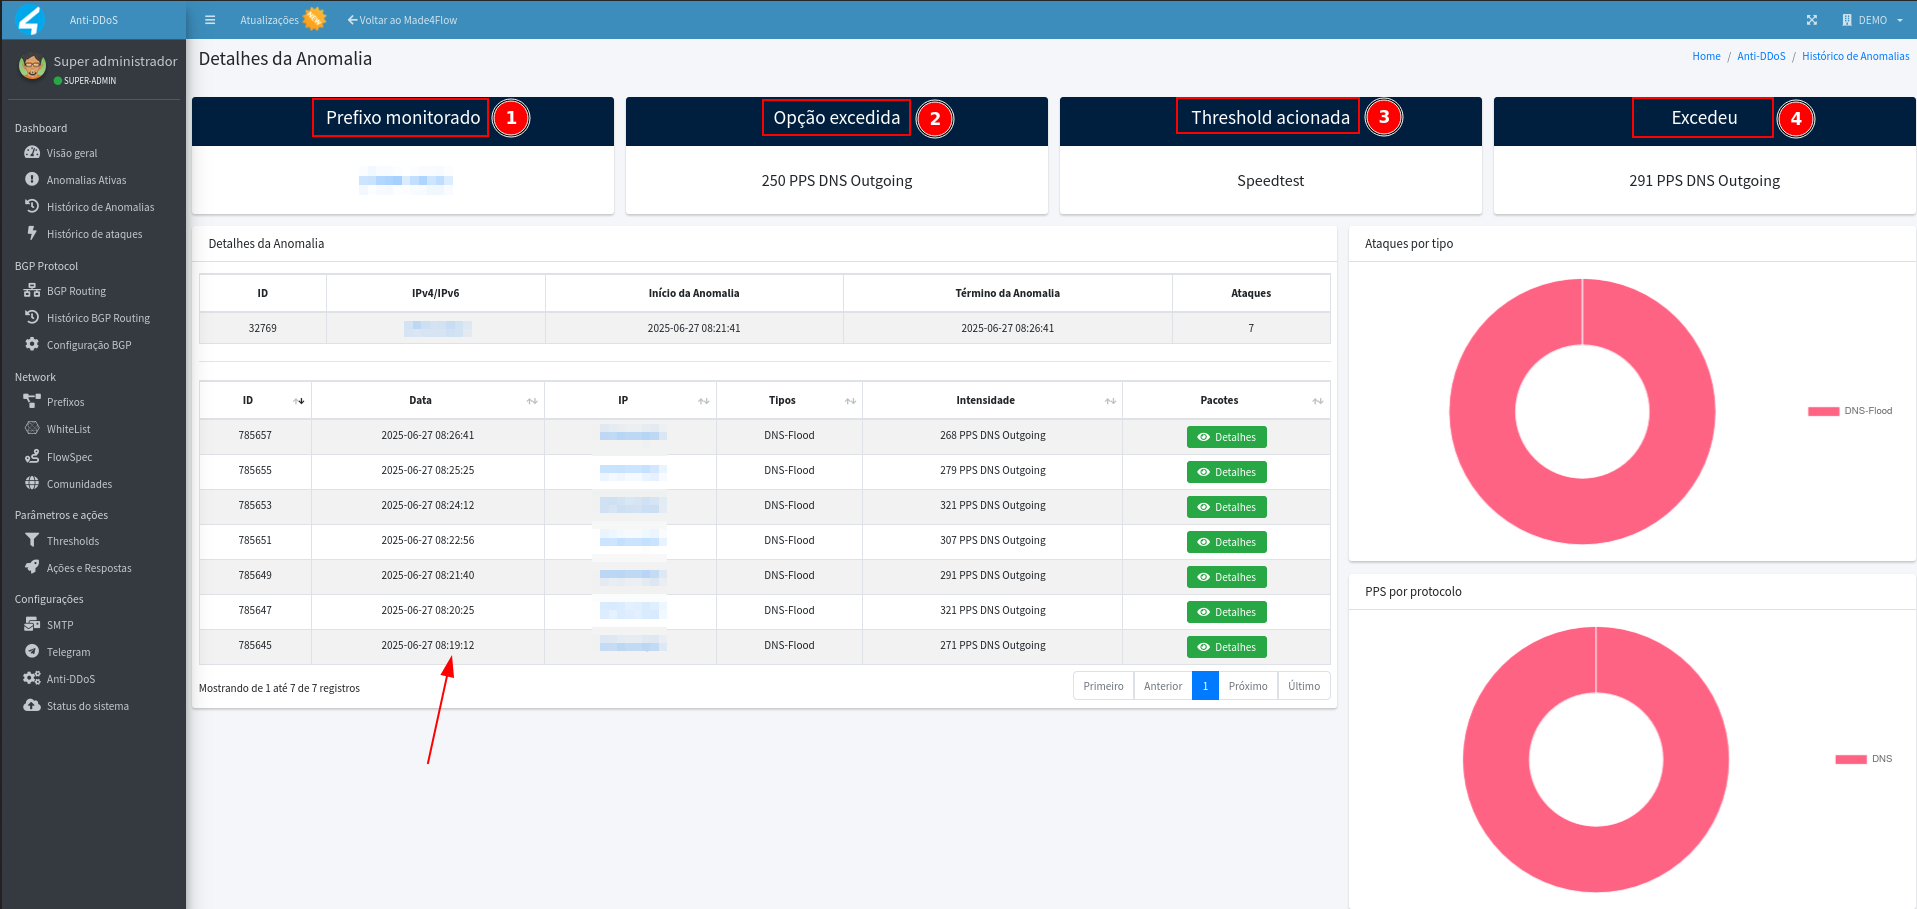
- We can also view even more details about that prefix or unique IP using the statistics, by clicking on the IP itself or prefix that are shown in blue links.
-
The redirection to the statistics applies to all information presented in blue links:
- In the statistics we can see a series of information related to the selected IP or Prefix:
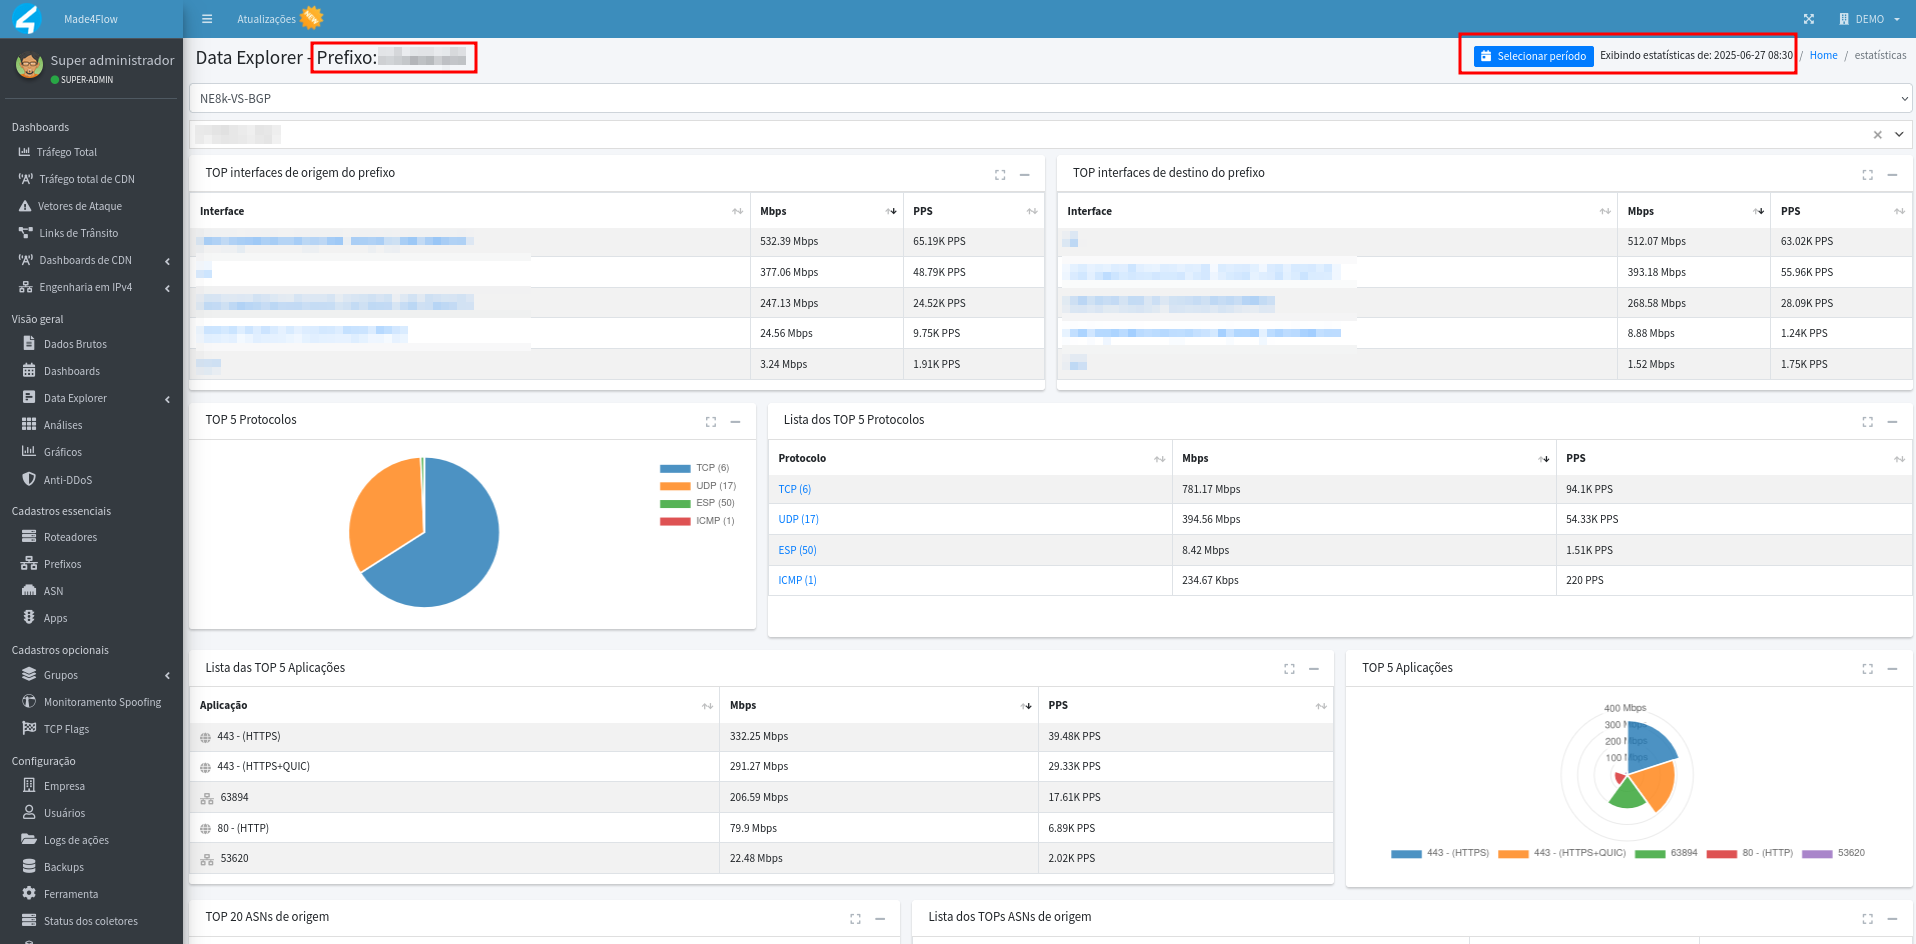
- In the statistics we can see a series of information related to the selected IP or Prefix:
¶ Damping Rules (Damper)
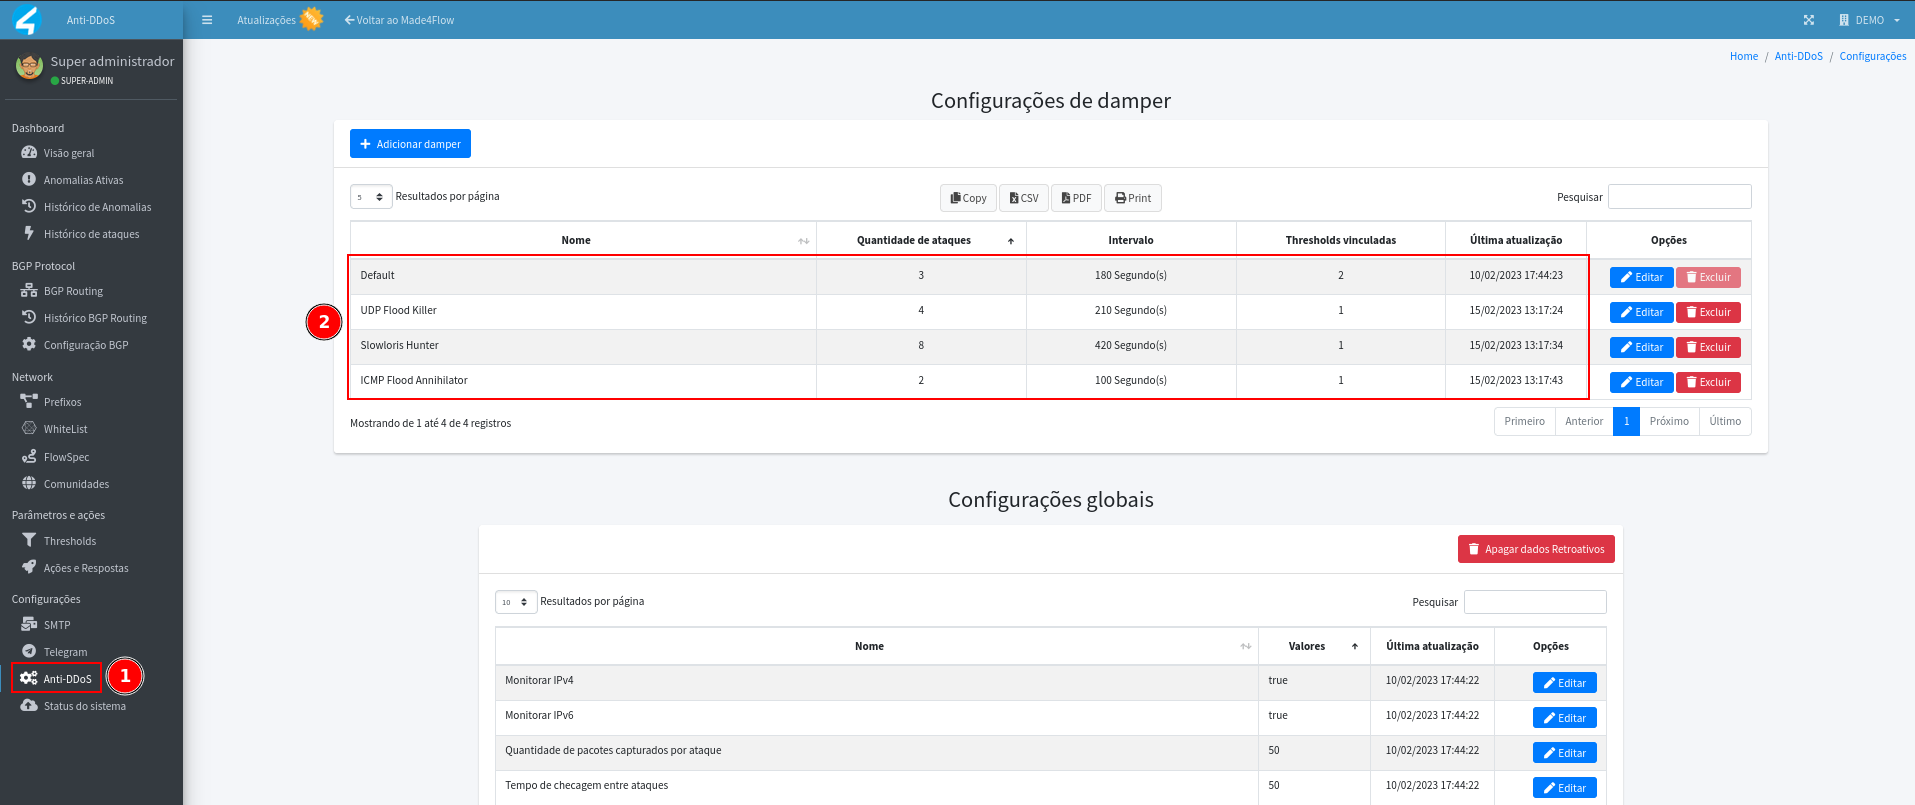
Damping rules are configured within the Anti-DDos settings tab.
- By default, any anomaly that exceeds any threshold 3 times or more within 180 seconds is considered an attack, but it is possible to customize this sensitivity by creating new dampers:
¶ Validation of anomalies based on Made4flow graphs
Use the Made4Flow graphs to validate that the anomaly corresponds to traffic spikes.
- On the home dashboard, look at the Total Traffic graph.
- Peaks close to the time of the anomaly may indicate attack:
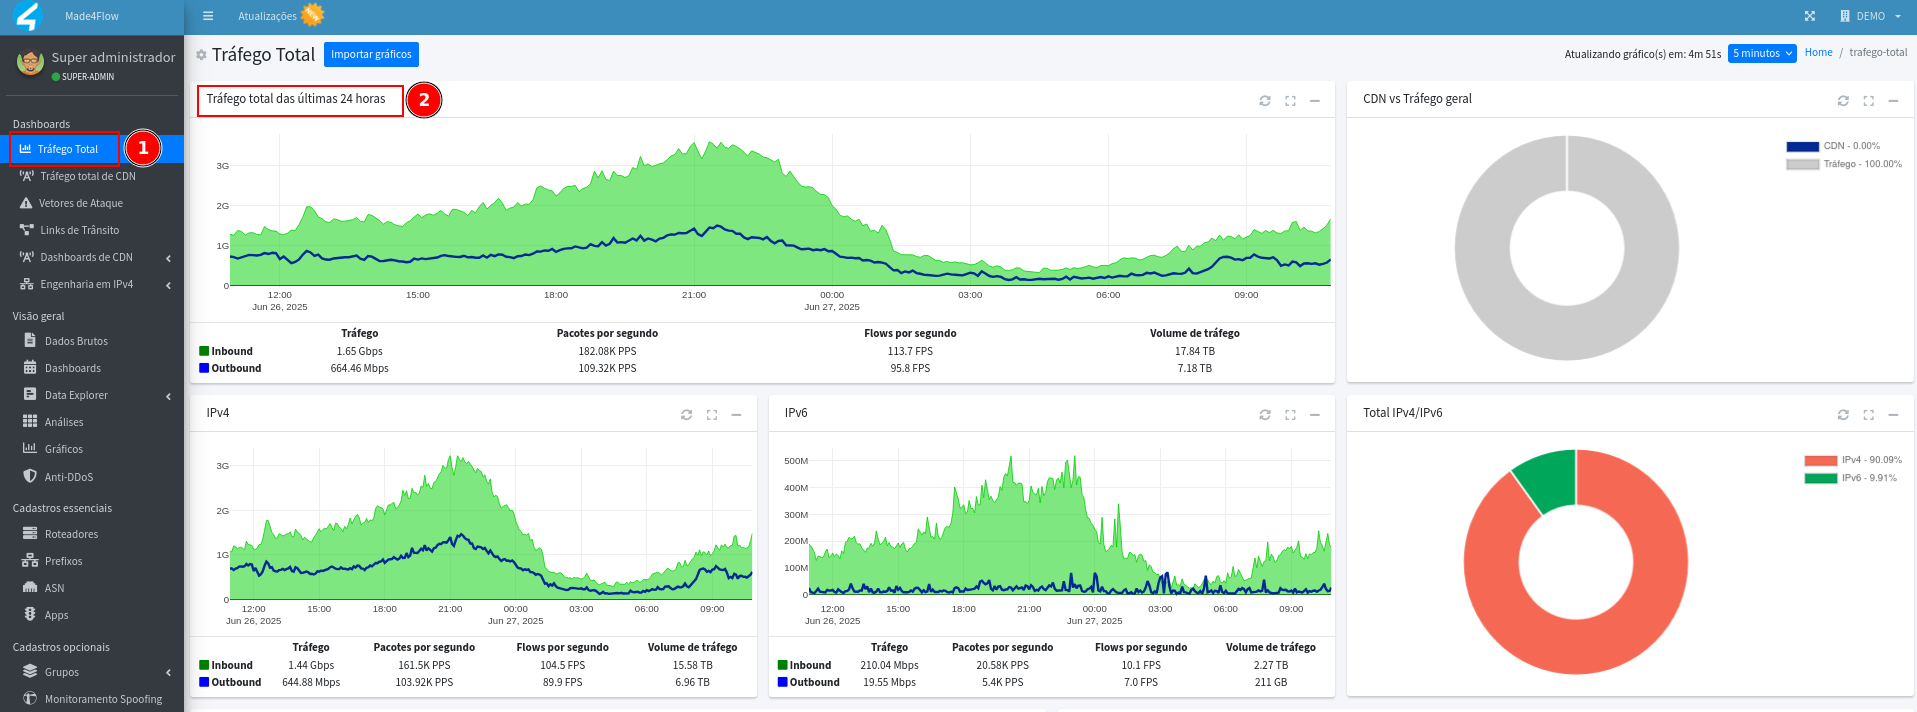
If the difference between the total traffic and the attack is large (ex: 300G) and the attack (ex: 1G), the anomaly may not be evident from this graph, due to the proportion of the values.
- Then, for more details, go to the Graphics tab and select the graphic that best fits your scenario, as in the examples below:
-
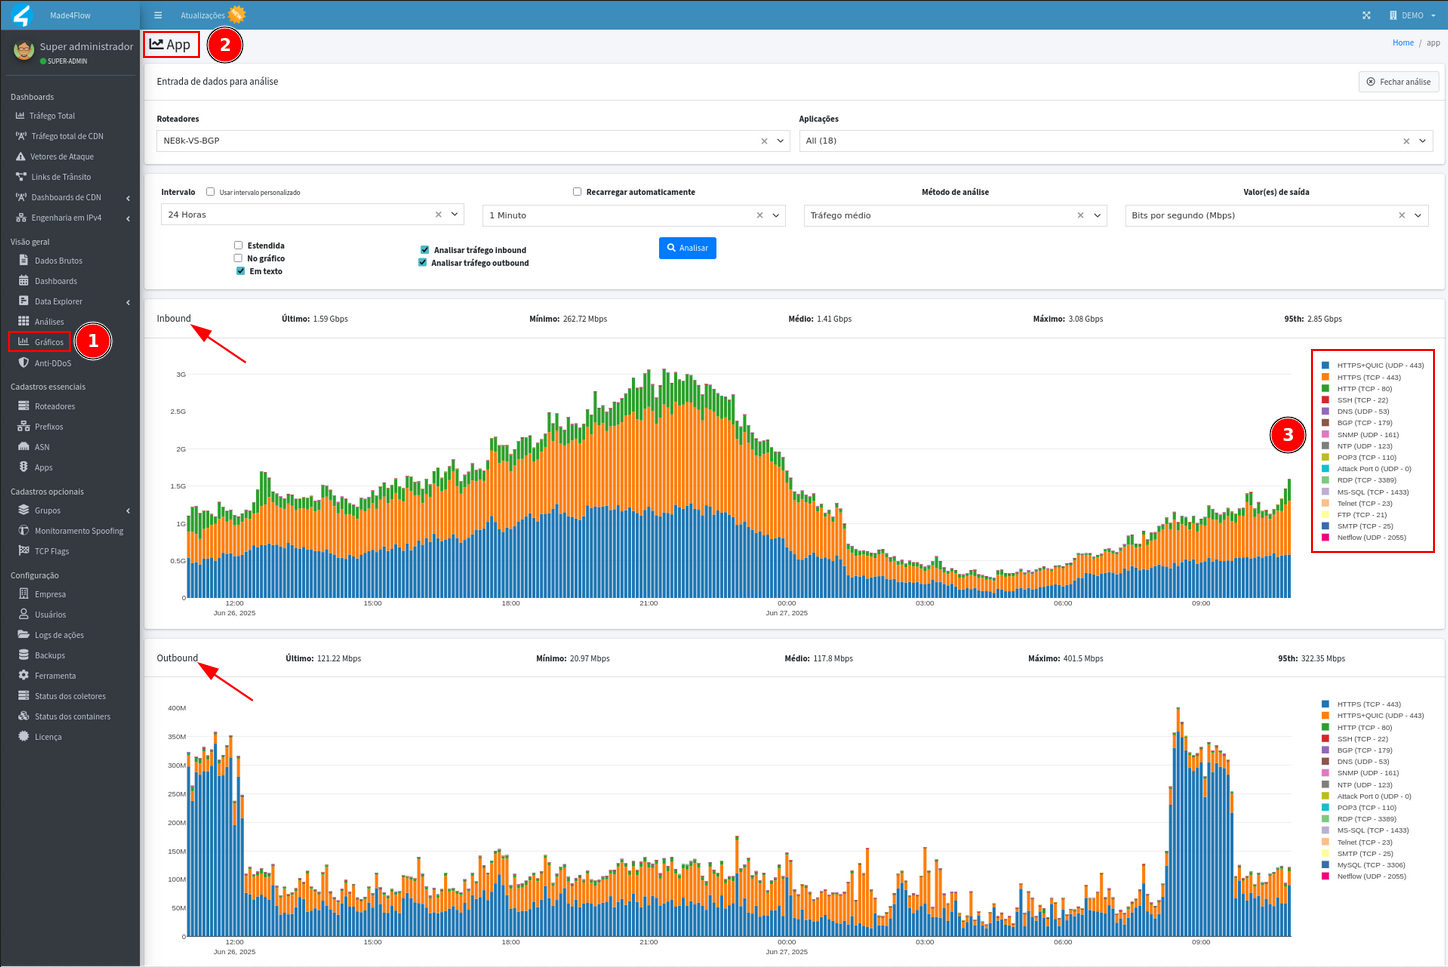
Anomalies of Port 0 (UDP), DNS 53 (UDP), HTTPS 443 (TCP), HTTP 80 (TCP), SMTP 25 (TCP), SNMP 161 (UDP), SSH 22 (TCP), Telnet 23 (TCP), etc., the App graph can be used, where it is possible to view traffic directly through these applications:
-
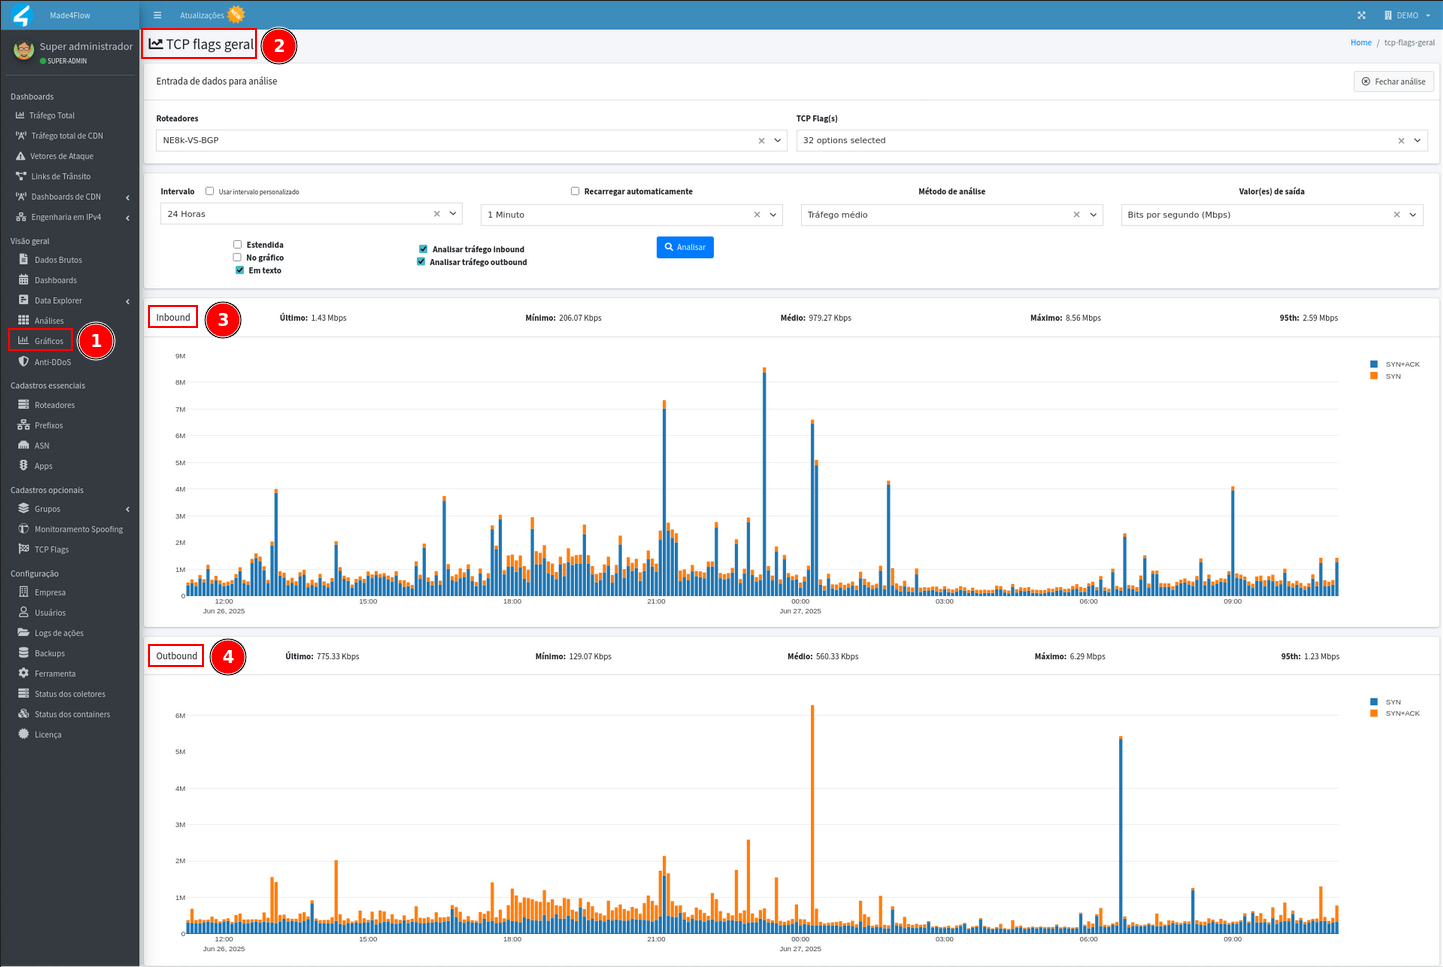
SYN flood anomalies, the TCP flags general graph can be used, where it is possible to filter the SYN flags and view specific traffic:
-
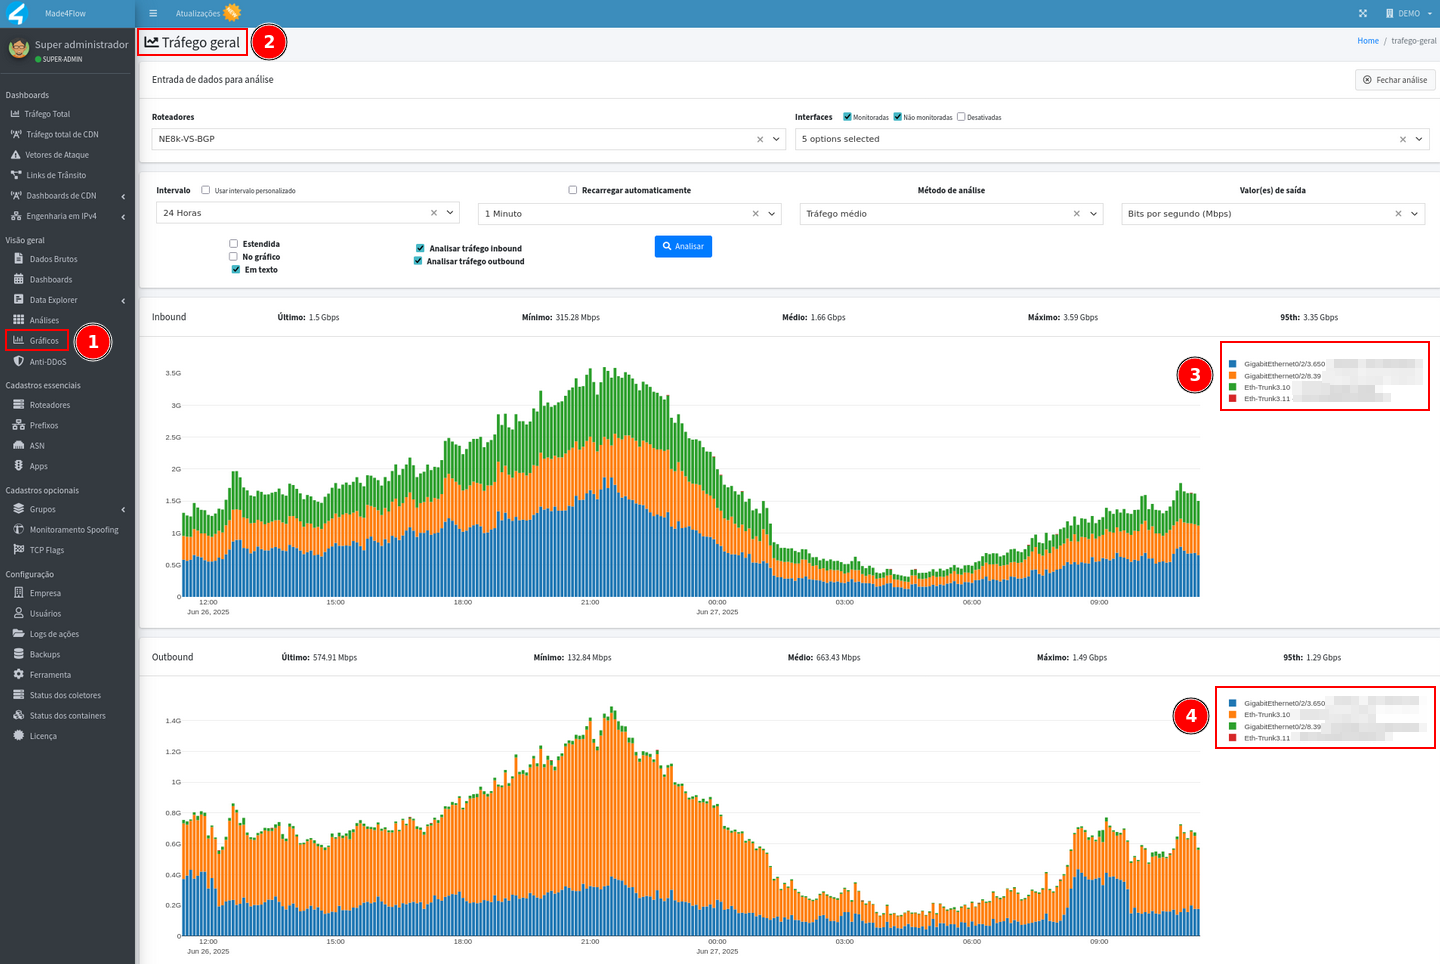
TCP flood, UDP flood or “Generic” anomalies - which consider total traffic regardless of protocol and port, for these cases the General Traffic graph can be used, where filters can be defined by interface:
-
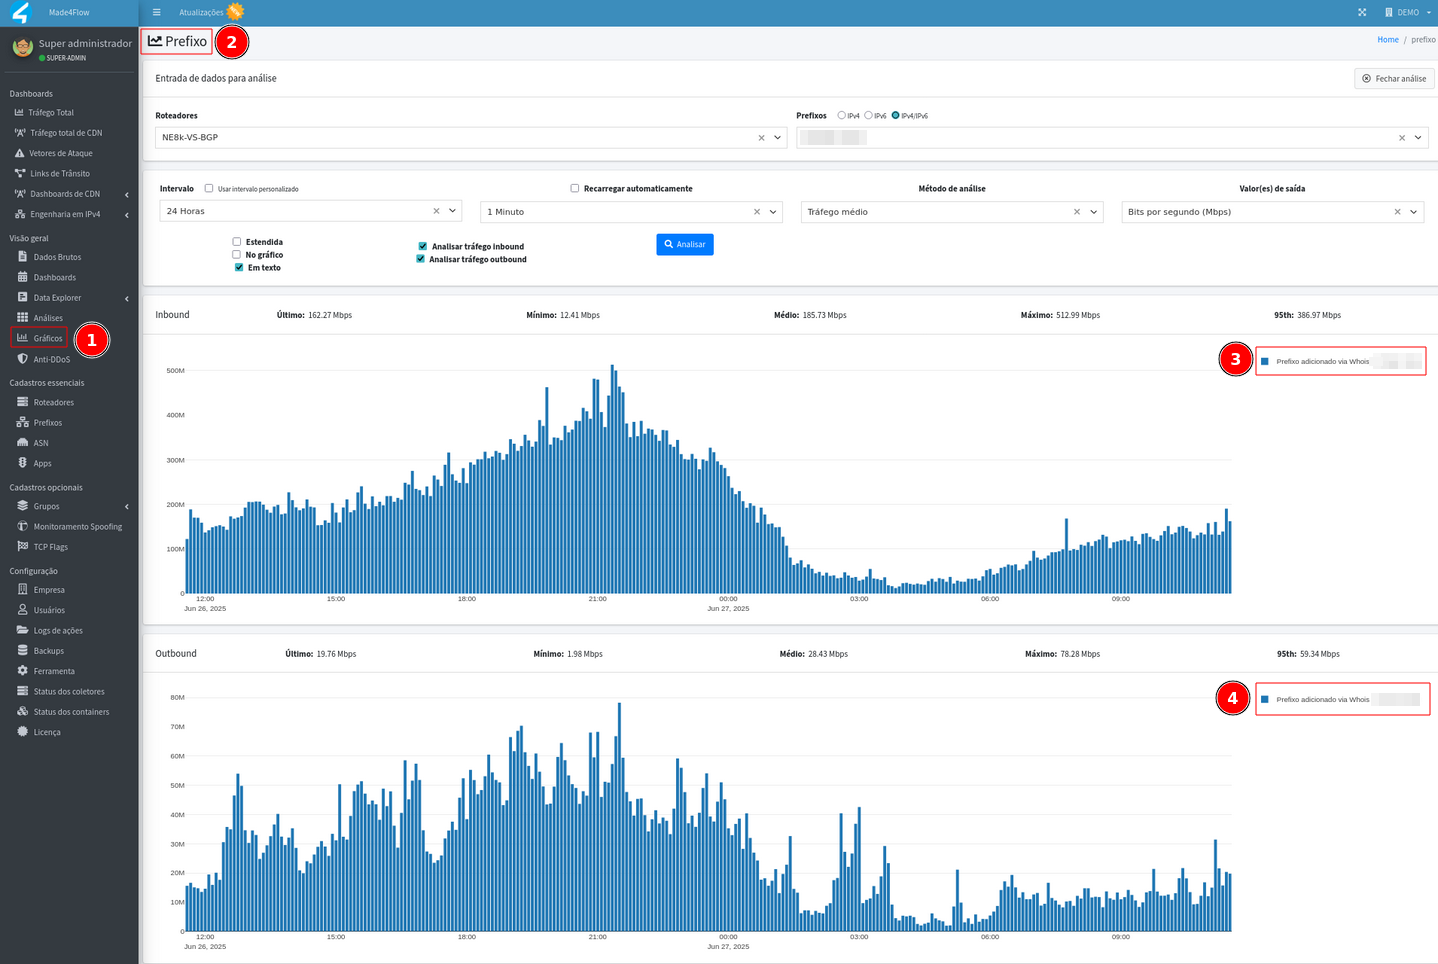
Another widely used graphic is Prefix, where the possibility of filters is based on the quantity and granularity of your prefixes registered in Made4flow:
-
- Also use other graphics if necessary, compare the anomaly data with the inbound and outbound graphs, observing the same time, attacked IPs, interfaces, ports, applications, ASNs, and/or main prefixes. It is important to emphasize that the data in Made4flow is updated on the graphs every 5 minutes, that is, each bar represents the average of the last 5 minutes of traffic. It's worth remembering that Anti-DDos analyzes traffic in real time. Based on this data if the graph is:
- **No peak: ** probable false positive.
- **With peak: ** possible attack, for more details of this traffic anomaly, click on the bar to access the raw data.
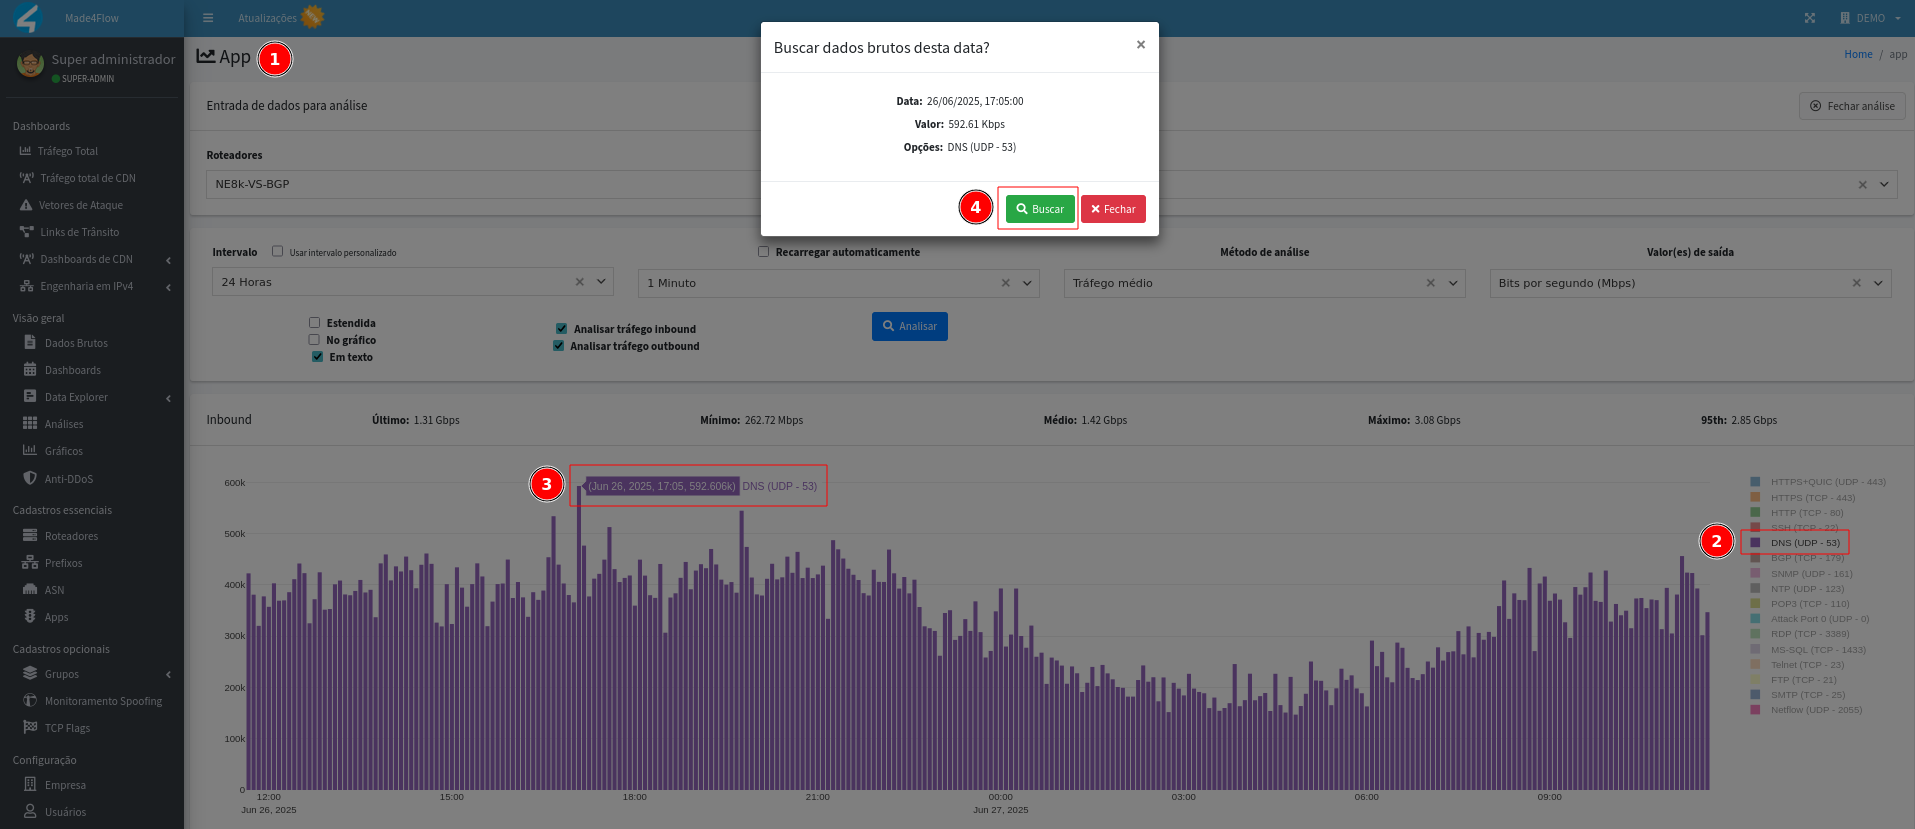
In addition to the other possible filters, the Output Values: Bits per Second or Packets per Second and also the Custom Interval are very useful.
¶ Raw data
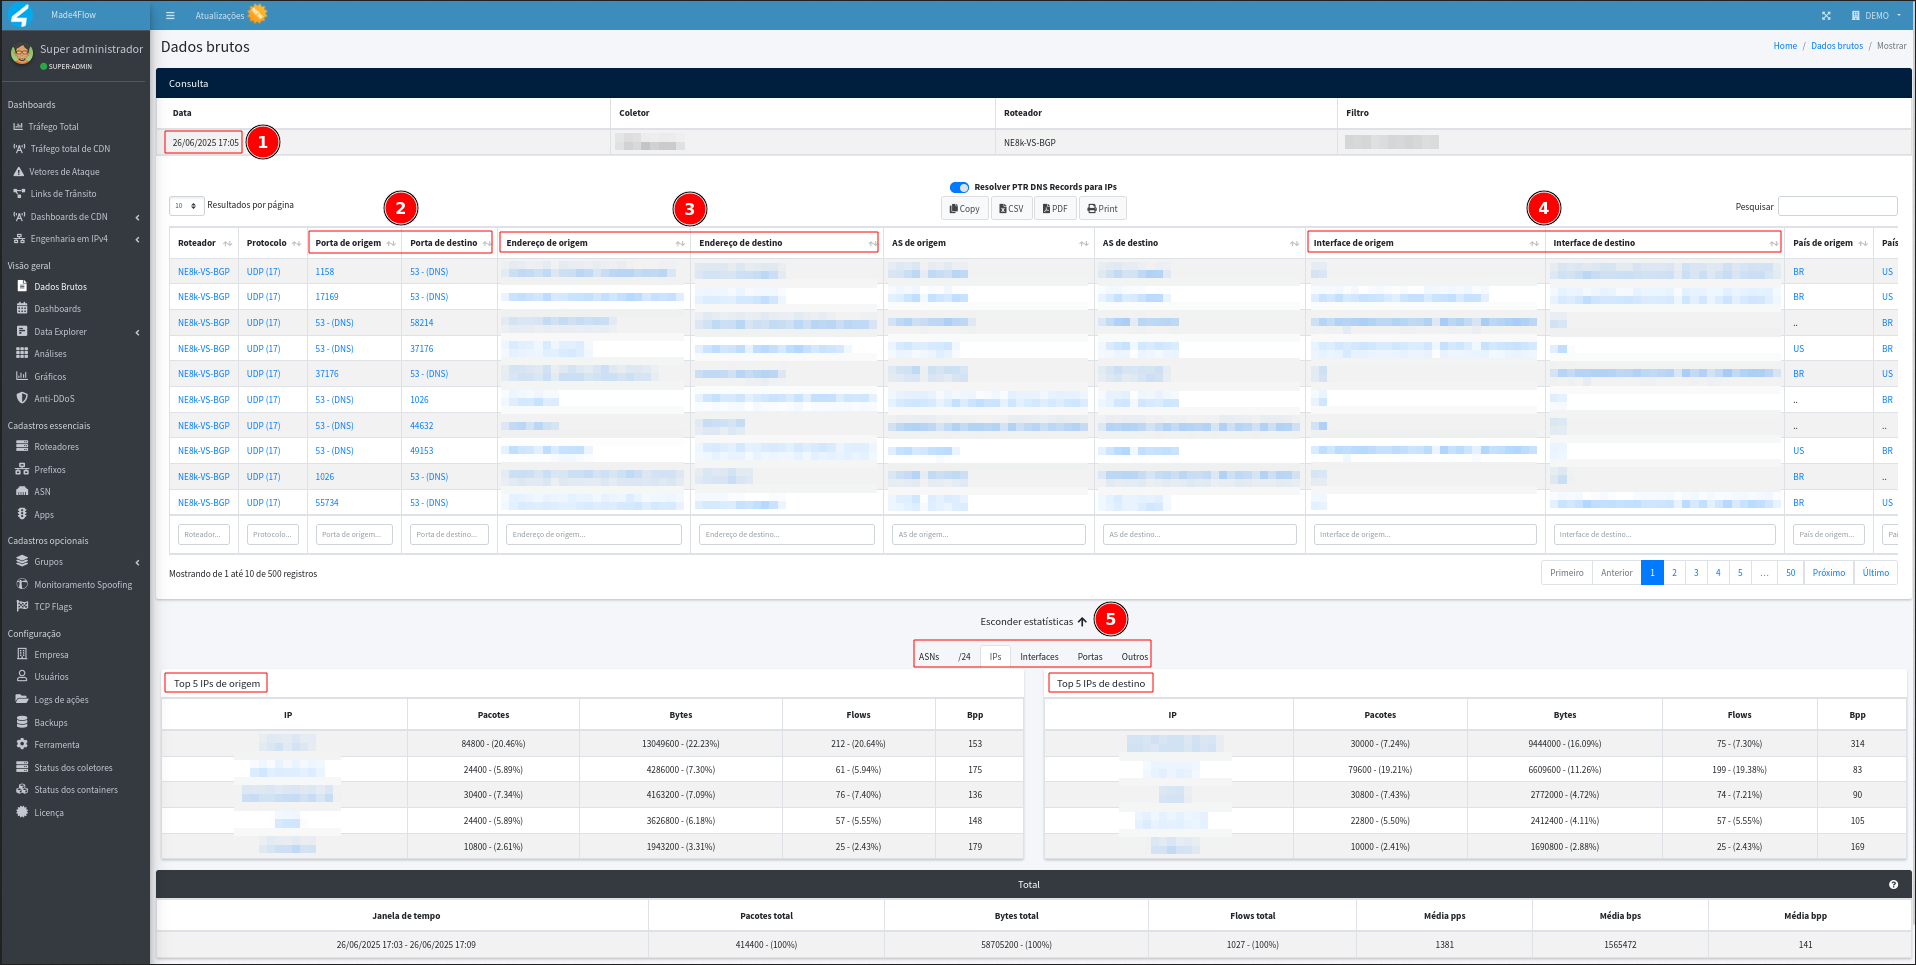
The raw data represents traffic details collected in the last 5 minutes of the period selected in the graph.
- When accessing the raw data screen that was opened through the graph, several important information will be displayed to be analyzed, such as:
- Date and time of the raw data, important to be exactly the same as the anomaly
- Source and destination port
- IP address of origin and destination
- Source and destination interface
- At the bottom of the screen, we can see some relevant statistics for analyzing the anomaly, shown as TOP 5 origin and destination, for IPs, /24 prefixes, ASN's, interfaces, and others. This shows us a percentage ranking of Packets, Bytes, Flows, and Bytes per packet, making it easier to see the main IPs affected and what path the anomaly went through.
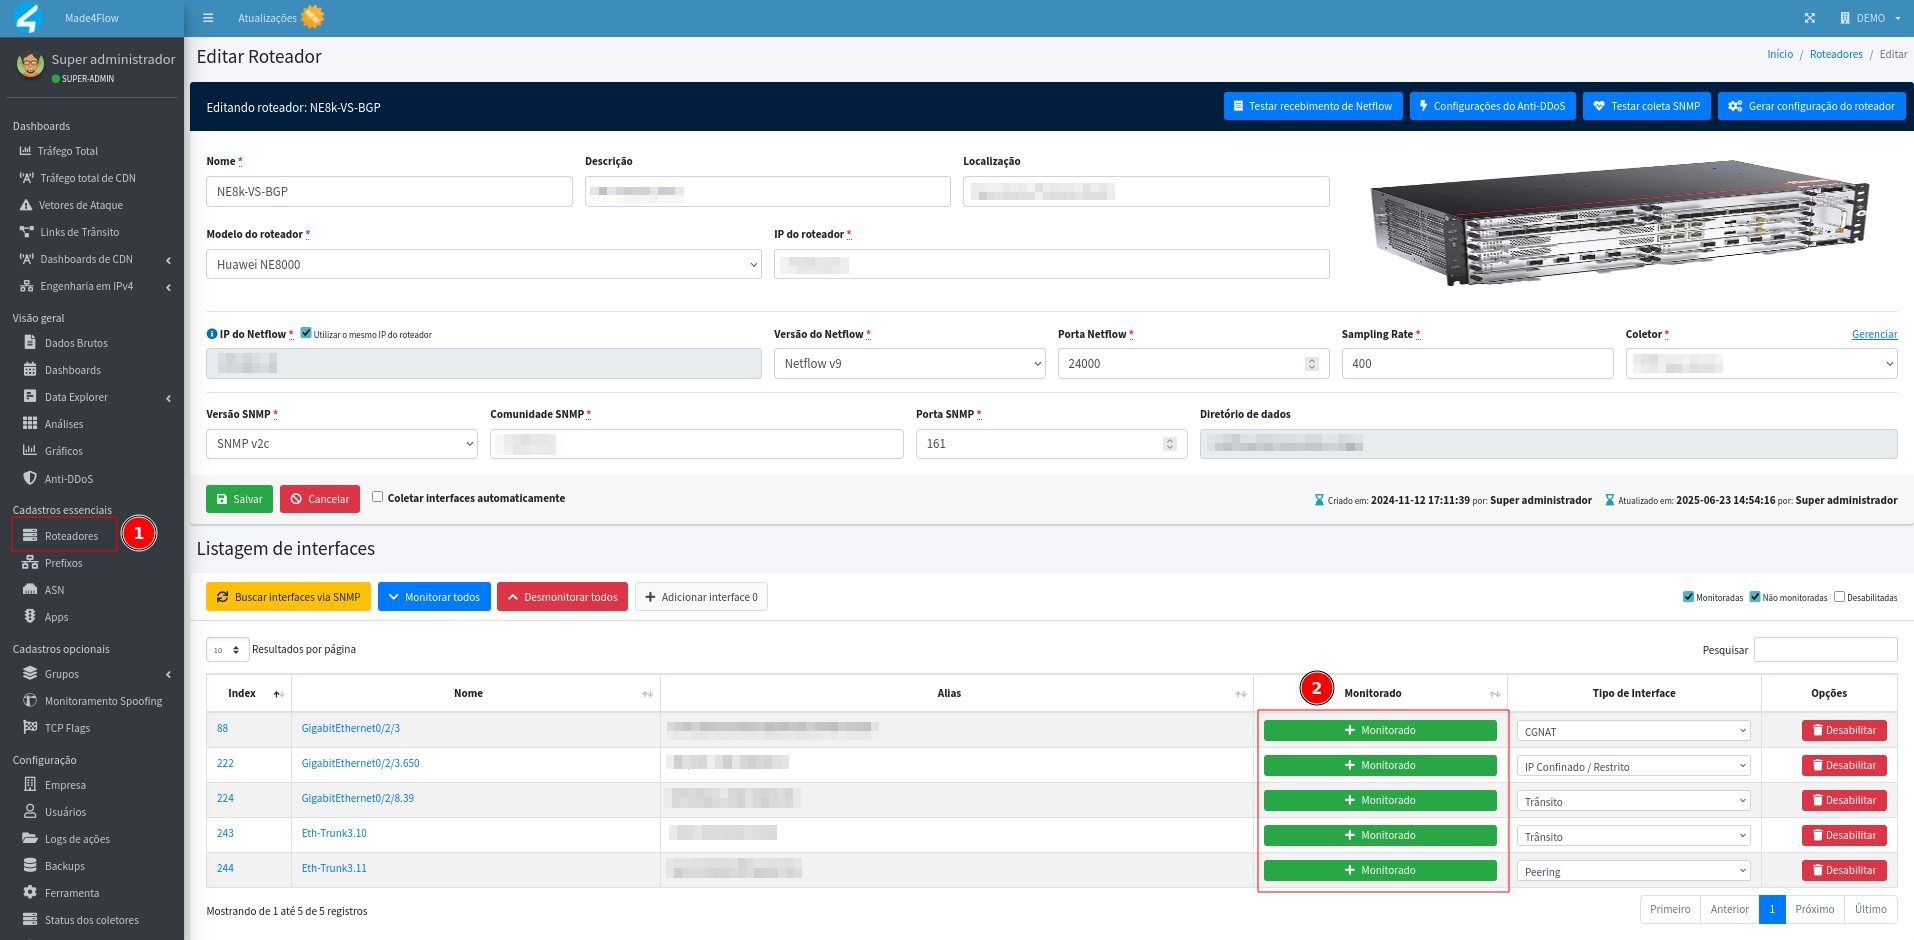
For the data to be analyzed by the tool, all interfaces that have traffic and that you wish to monitor must have the netflow export settings applied to the equipment and be as monitored when registering the equipment in Made4flow.
¶ Confirming false positive
-
If the graphs do not show any peaks or abnormal patterns, the anomaly alerted is certainly a false positive.
-
Return to the Anti-DDos anomaly details screen and “write down” the values of:
- Option Exceed
- Threshold triggered
- Exceeded Amount
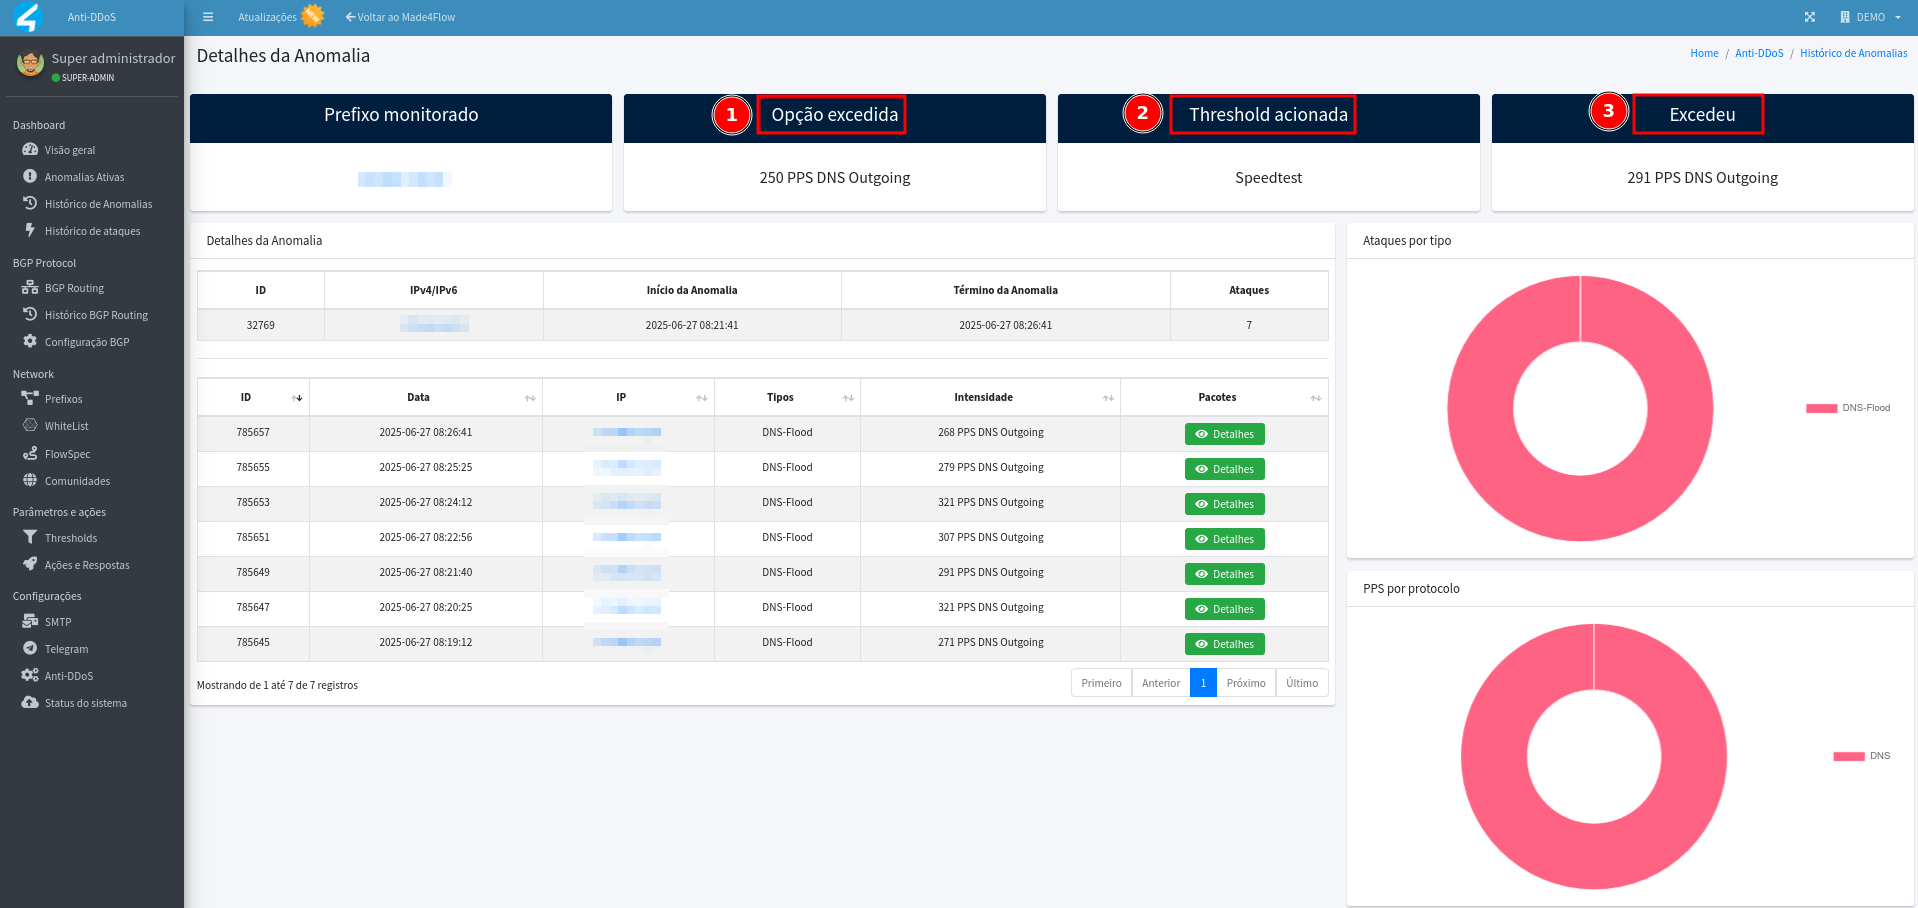
¶ Adjusting thresholds
-
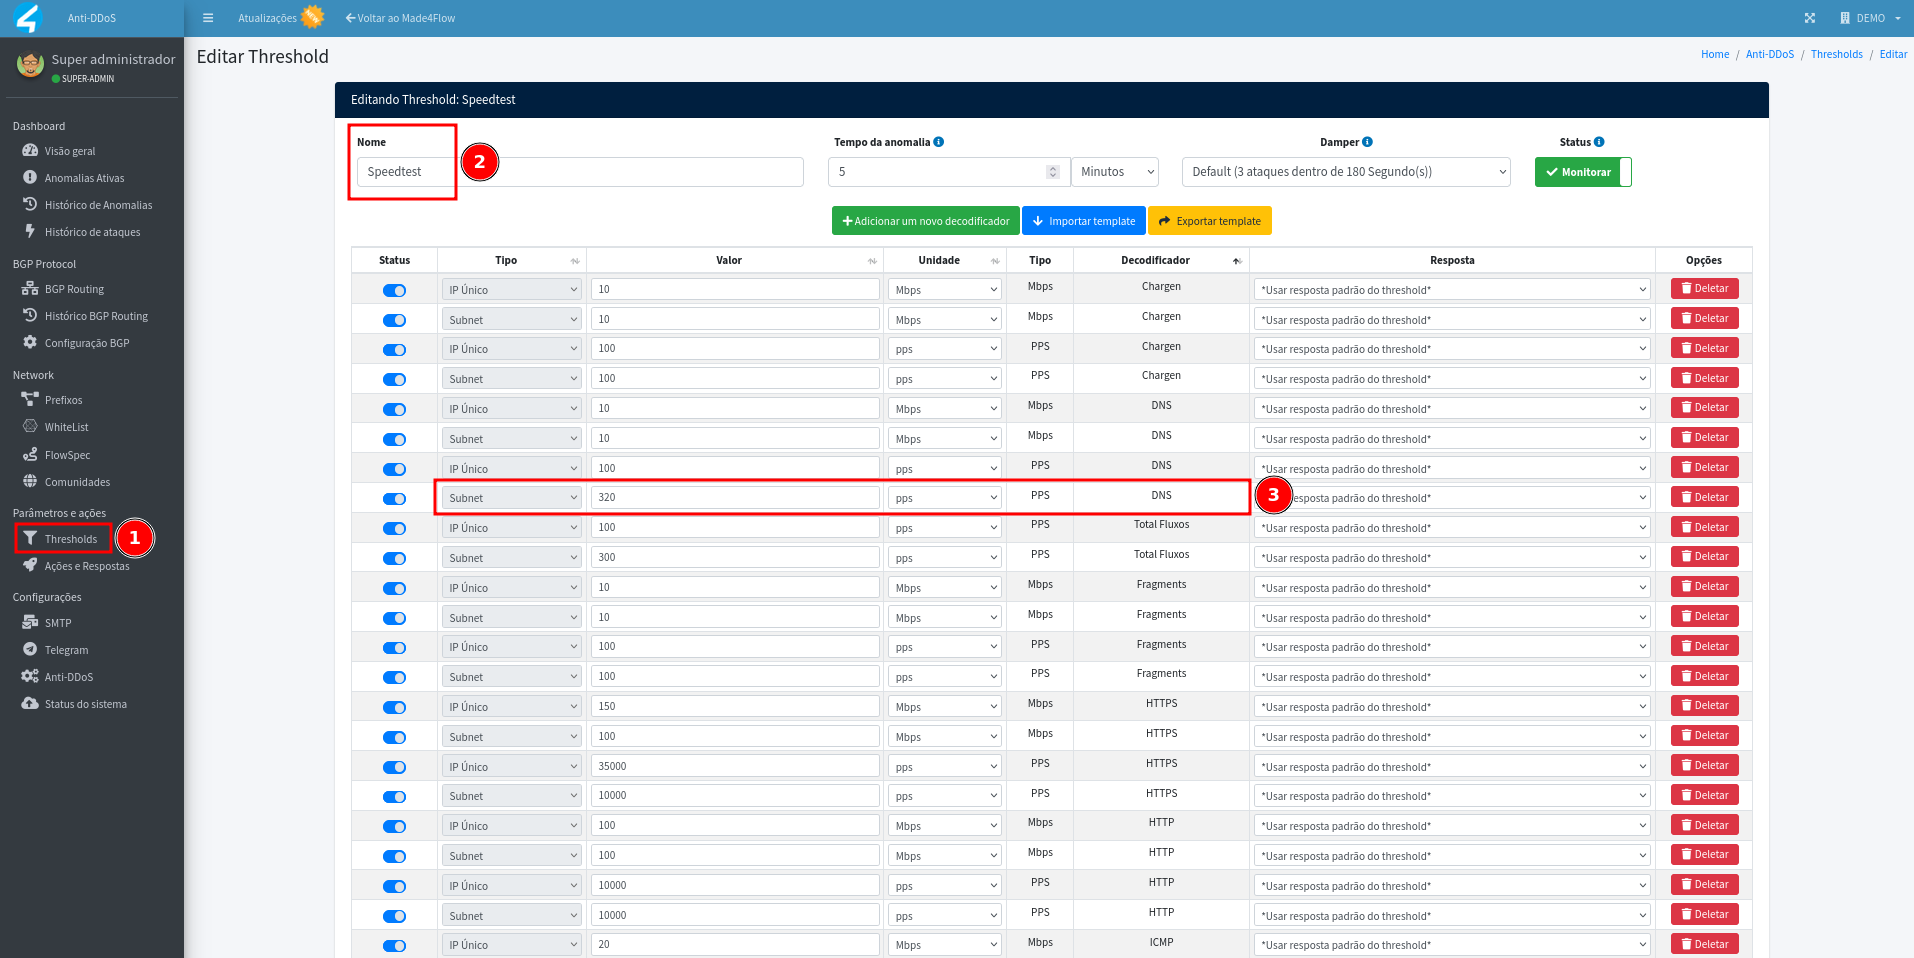
Open the thresholds tab, select the threshold that was alerted, in the Speedtest example.
-
Order the rules by the column of decoders to make it easier to find.
-
Adjust the exceeded rule, increasing the value about ** 10% above what was alerted**. In the example from the previous image, the DNS rule of packets per second for Threshold Speedtest Subnet detection was defined as 250 pps, the value exceeded was 291 pps, increasing approximately +10%, and we have the new value of 320 pps:
-
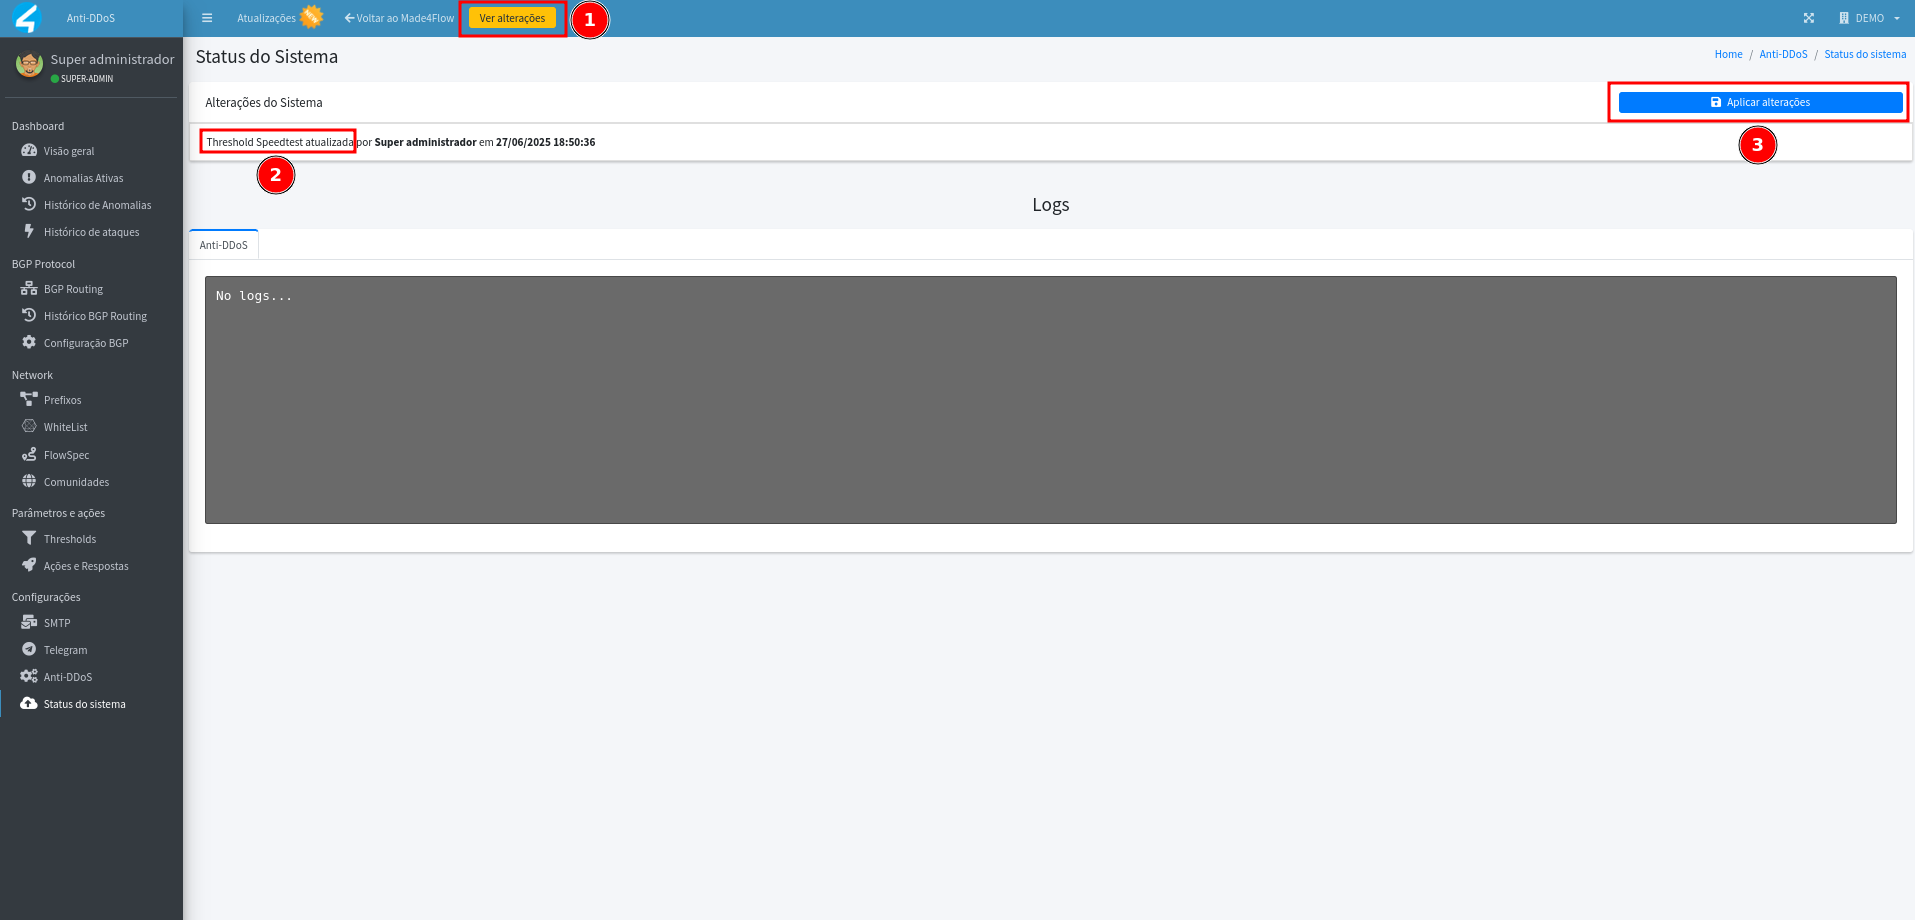
After adjusting it is necessary to apply the changes:
- Click See changes (yellow button).
- Click Apply changes.
¶ Final Thoughts
By following this process, it is possible to identify more precisely whether an alert is in fact an attack or a false positive, guaranteeing more assertive actions and avoiding unnecessary advertisements.